
We learn about things in mundane ways. Our conception of the Pacific Decadal Oscillation (PDO) began with fish. Salmon are absolutely delicious. Tough handed people venture into dangerous conditions to catch them for us. It became apparent to the tough handed, and lily handed entrusted to manage the resource alike, that the ease and difficulty of catching these fish followed a cycle.
From fish it went to this and Kevin Mantua developed an index for it. It was discovered that PDO phases corresponded to rainfall in China. The header picture of this blog is the Shen index which goes back over 500 years to when they started measuring rainfall over there. We’ve discussed various indices before.
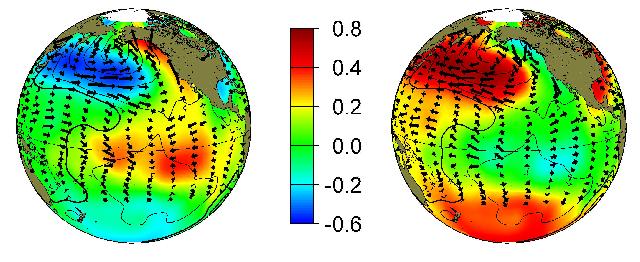
So now we have fish, warm and cold water, and wind. All good real things we can measure. Notice how they have correlated Southern Ocean warming with what I call the Nina phase. The phases of the PDO are variously called “negative” and “positive” and “cold” and “warm”, completely subjective names whose meaning depends on where you happen to be looking from. I prefer the gender names because one phase favors El Niño’s and the other La Niña’s. There is some basis for this correlation in the Southern Ocean but it is controversial and it seems not to match the record sea ice extent we see today.
Enter the bean counters who generate the real world image above as an example of the Nino phase during a period (March, 2012) that happens to be during the current Nina regime. They did this by taking data for an anomaly, which is the difference between what is measured and an (in this case) undisclosed baseline , and dividing it by the global anomaly. This is a tactic usually used to cancel any trend, which they certainly accomplished because they were able to show a Nino pattern when the trend was strongly to a Nina phase. Maybe this shows that there is signal for both phases all the time, but I just like fish better.
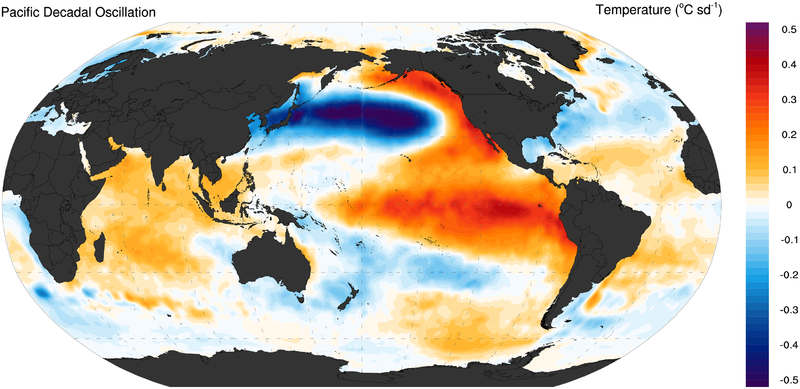
I like this one because it discloses the base period and it happens to be during the instrumental era when someone besides drunken sailors was taking the measurements. It must be remembered that satellite measurements of sea surface temperature did not begin until 1981.
This hot spot on the end of the classic Nina tongue of warm water in the North Pacific has not been in the program. It’s seeming correspondence with the record-breaking drought in California makes it all the more interesting.


“The header picture of this blog is the Shen index which goes back over 500 years to when they started measuring rainfall over there.”
Do you have a link for that data?
Pacific Decadal Oscillation Reconstruction
———————————————————————–
World Data Center for Paleoclimatology, Boulder
and
NOAA Paleoclimatology Program
———————————————————————–
NOTE: PLEASE CITE CONTRIBUTORS WHEN USING THIS DATA!!!!!
NAME OF DATA SET: Pacific Decadal Oscillation Reconstruction
LAST UPDATE: 4/2006 (Original receipt by WDC Paleo)
CONTRIBUTOR: Caiming Shen, State University of New York, Albany.
IGBP PAGES/WDCA CONTRIBUTION SERIES NUMBER: 2006-045
SUGGESTED DATA CITATION: Shen, C., et al. 2006.
Pacific Decadal Oscillation Reconstruction.
IGBP PAGES/World Data Center for Paleoclimatology
Data Contribution Series # 2006-045.
NOAA/NCDC Paleoclimatology Program, Boulder CO, USA.
ORIGINAL REFERENCE:
Shen, C., W.-C. Wang, W. Gong, and Z. Hao. 2006.
A Pacific Decadal Oscillation record since 1470 AD reconstructed
from proxy data of summer rainfall over eastern China.
Geophysical Research Letters, vol. 33, L03702, February 2006.
doi:10.1029/2005GL024804.
Thanks. I tracked that down to ftp://ftp.ncdc.noaa.gov/pub/data/paleo/historical/pacific/pdo-shen2006.txt