
For some reason the validated CDC data for March in San Francisco have been excruciatingly slow, and judging from local data will be revised down slightly. This is peculiar because it was raining hard as March came to a close and the original data indication was from a few hours short of the end of the month. Anyway, it has rained in April and there is no way this years drought will be in the top ten for the Downtown San Francisco dataset, at 164 years the longest in the western U.S.
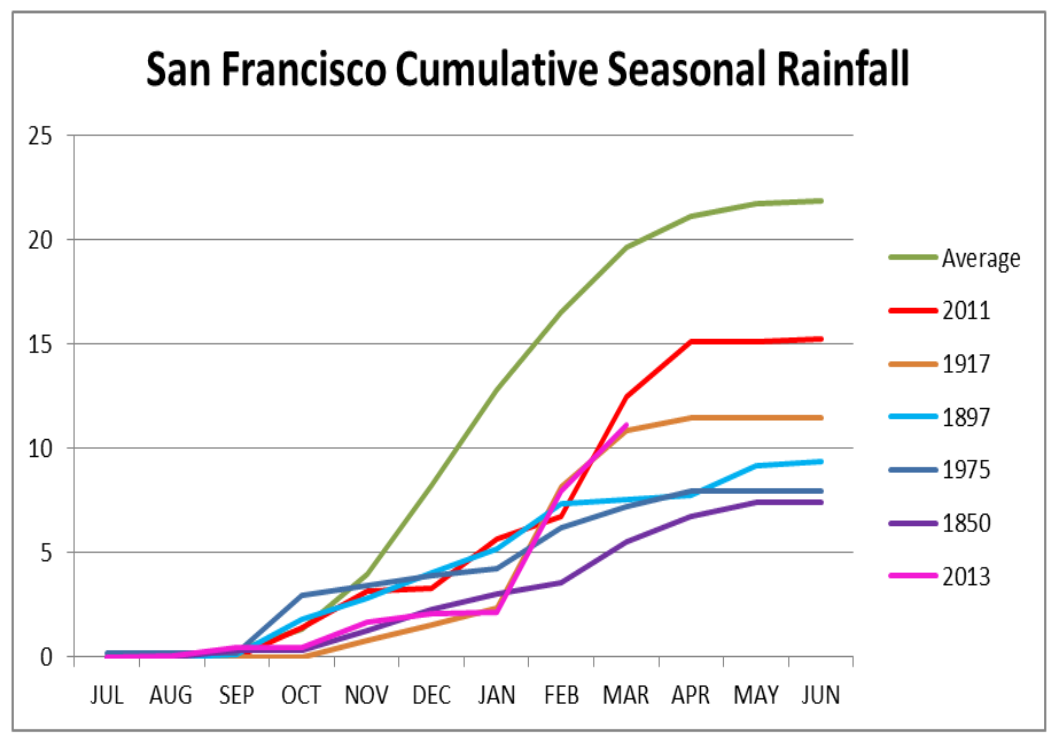
The data is structured July to June so April 2014 falls in the 2013/2014 season shown here as “2013”. Spooky how closely this year is tracking 1917. The four driest years are shown along with 2011 which was the first year of our so called “record drought”.
We checked the data for any indication that in dry years more rain was pushed into May and June. Nope. Although 1897-98 with only 9.38 total got 1.63 in May and June, the average for the ten driest years is only half the total average for May and June.
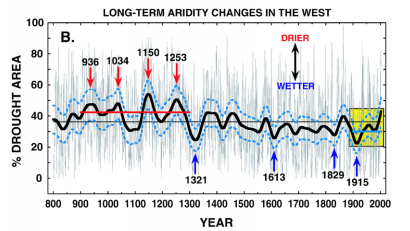
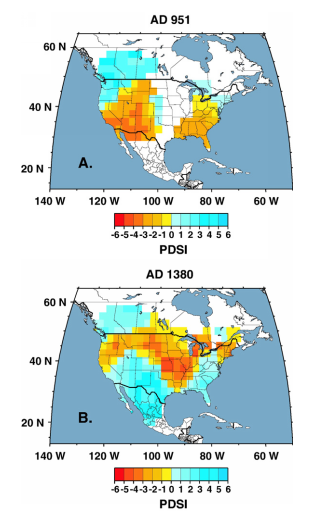
There is quite a bit of research on past droughts in California and the western U.S. This is from Cook et al 2007 using the Palmer Drought Severity Index. It is interesting as a big picture because it shows a persistent pattern of drought during the Medieval Warm Period and pretty damp until the present when the climate generally seems to be recovering from the Little Ice Age. Within the MWP notice the rapid transition from drought to damp from 1034 to 1100 and return to extreme drought by 1150. These human life scale changes should be bourn in mind. How crazy would “climate change” have seemed to the Anasazi. What sins would they have repented as they abandoned Chaco Canyon in 1130? The western U.S. is a big place and averages mask a lot of regional variation. 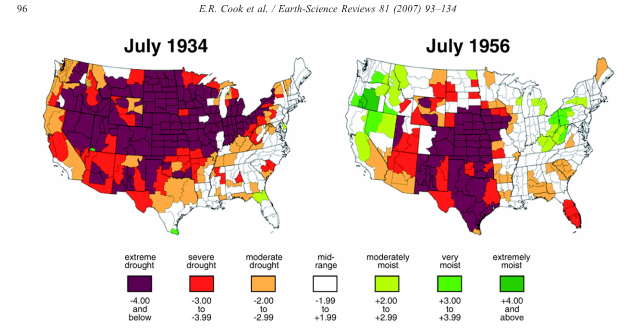 These two years are considered iconic for the two most severe twentieth century western U.S. droughts. Notice the very different conditions for California and the Pacific Northwest between the two regimes.
Zooming in to California we find more complexity from the sediments from our drying fluvial lakes.
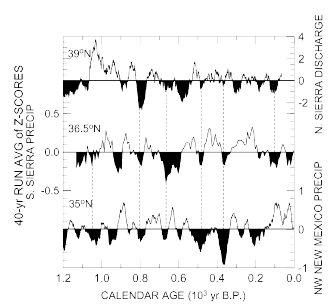
Benson 2002 cored Pyramid, Mono, and Owens lakes in the style of the Deep Sea Drilling Project and analyzed Carbon and Oxygen isotopes and other properties of the layers. I hate the units but 1.2=12000 years ago, the end of the last glaciation. One can see the Younger Dryas cold setback up to 11500 and tentative recovery in New Mexico but recovery from it seems to have taken longer to register in the Sierra. The dotted lines are suggested correlations. My eyechrometer says the northern Sierra and New Mexico are more often antiphase than not and the southern Sierra has its feet in both worlds. This is another reason to like the San Francisco dataset. We can expect that future rainfall for California will not necessarily be tandem to the rest of the western U.S. and may alternate between regions of the state.
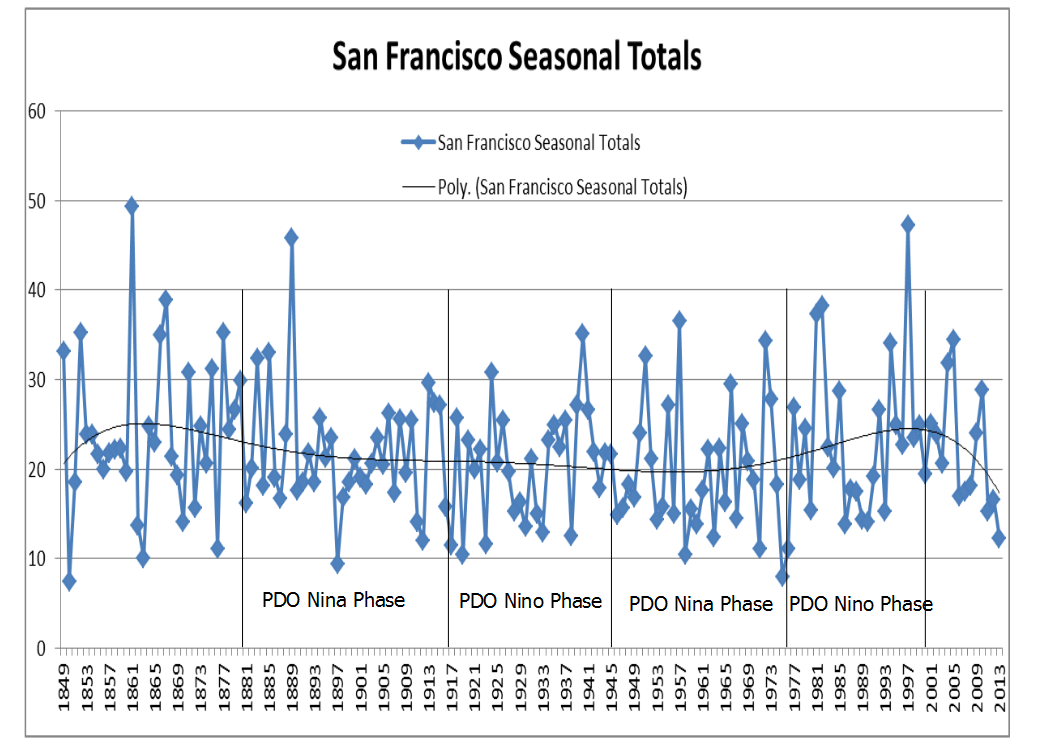
To whatever extent these 164 years represent the 12,000 years since the last glaciation, San Francisco, like California, has its fingers in many puddles. As you can see San Francisco is not particularly impressed with the Pacific Decadal Oscillation, an observed pattern that seems to control the frequency of El Niño’s.
The good news is that the data shows that very rarely do dry periods last more than a few years.


Pingback: The Terribly Tenacious Trough | geosciencebigpicture