
One often hears it said that the “heat absorbing” properties of CO2 in the atmosphere are “well known” or “well understood”. This is definitely not the case. The properties of CO2 in the atmosphere are presupposed to be simple, and held up as doctrine, but the investigations outlined below reveal many surprising complexities and ambiguities.
MODTRAN is a very mature model derived from thousands of measurements by very serious folks in the US Air Force with no agenda but to get it right. The public release in a form that allows comparison of both up and down perspectives from any altitude, in one meter increments, and to isolate individual gasses; allows an insight into the role of CO2 in the atmosphere that to the best of my knowledge has not been previously explored.
MODTRAN is a model. It is a good one, but it is not perfect. It is possible that some of the results found here are model artifacts. MODTRAN is about light, not heat. Even though the modern custodians of the program have labeled a principal value “Downward IR Heat Flux”, the currency is photons.
Although interpretations of the surprising results of this investigation are presented, no claim is made that these are the only possible interpretations. In fact, my own thinking has changed as this series progressed.
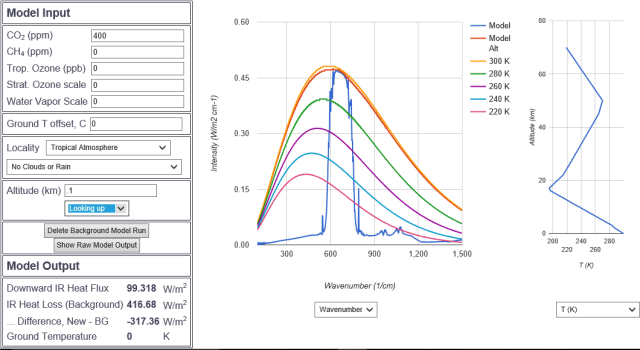
The first surprising discovery in this series was that in the first 300 meters of the atmosphere MODTRAN looking down sees no deviation from a blackbody spectrum in the CO2 bands; but looking up it sees strong deviation. The upwelling radiation (seen looking down) seems to be so completely thermalized that the atmosphere radiates as a unit, a brick if you will. CO2 is not individually distinguishable in reducing or increasing the radiation.The down welling radiation seen looking up from the same elevation is strongly increased in intensity, and the CO2 bands are clearly distinguishable.

In all of these images the “looking down” is the red background run or “Model Alt” and the blue is looking up.
It is fundamental in physics that radiation takes place equally in all directions (Isotropy). If from any altitude looking down there is no distinct signature of absorption coming up, we expect that when we turn around from the same place and look up we will also see no distinct signature of absorption coming down…but we do, and we see the same thing consistently from one meter to 300 meters in elevation.
CO2 molecules should not be able absorb or radiate in one direction only. The same molecules should not appear to be a brick looking down and a powerful absorber looking up. It is interesting to consider the blue curve from which the huge “spike” of downwelling intensity emerges. One should really try to imagine the graphic upside down because the warmest temperatures and greatest intensity are usually at the surface.
The Planck curves are the magic of this general approach to radiation because they unify temperature and intensity. When the blue downwelling curve from which the blue spike emerges clearly is not a Planck function we have no way to know if it harks from temperature (which can be equated to altitude by the lapse rate) or intensity. The most intense and warmest part of the blue spike clearly is a Planck function. The part that conforms corresponds to the fundamental wavenumber 667.4 “bend” and its rotational sidekicks.
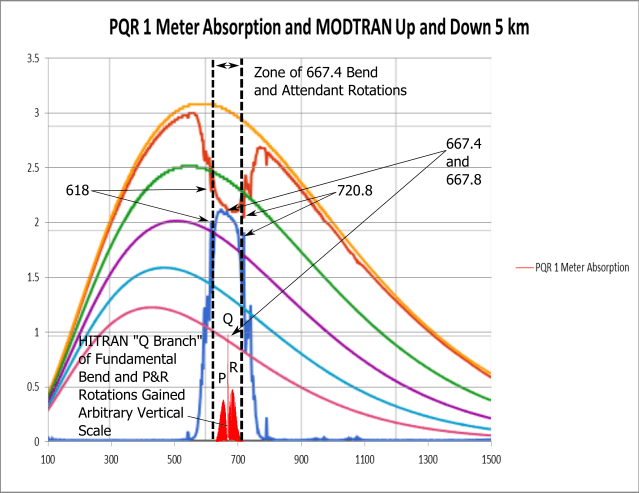
In the illustration above the relationship between the wavenumber ranges of the fundamental vibration (bend) of the CO2 molecule and the sloped Planck (blackbody) parts of the up and down CO2 signatures is shown for 5 kilometers elevation. At this elevation the downwelling blue spike emerges from a zero flatline showing only blips of weak third order transitions. The second order transitions (618, 667.8, and 720.8) are also shown. The 667.8 second order bend is so close to, and so much weaker than the 667.4 zero to 1 transition, it is essentially subsumed by it. The relationship of the ranges is what is important at this point. Details of CO2 transitions will be explored a little later.
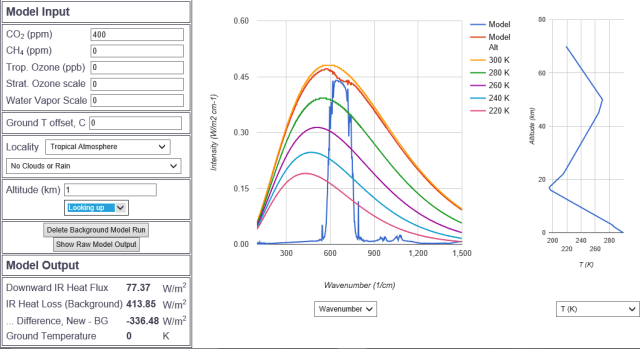
At 100 meters in the image above we see much the same thing, except that the fundamental CO2 bands looking up are no longer warmer than the brick.
At a kilometer we see deviation in the red from the blackbody curve as evidence of specific absorption (and radiation) in the CO2 bands looking down. CO2 is individually beginning to reduce the intensity of upwelling radiation.

At ten kilometers the CO2 spectral signature in upwelling radiation is very well developed and we can see a second surprising feature, the kissing conundrum. Up and down welling CO2 signatures always meet (kiss) at the wave number 667.4 spectral spike above 300 meters in the troposphere. We will get back to this this.
In the bottom left hand corner of the MODTRAN screens there are some numbers whose meaning is not immediately clear. “Downward flux” seems easy, but is it for just the selected gas or the entire atmosphere? “Background” seems general. To help understand them they are plotted for the first kilometer of the atmosphere below.
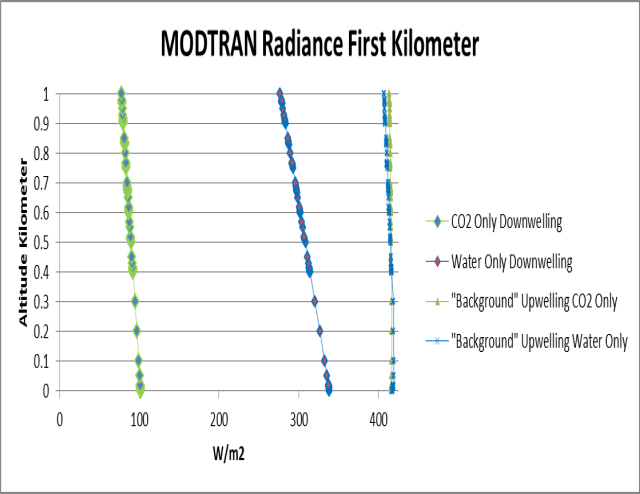
The two series to the left correspond to the “Downward IR Heat Flux” numbers on the MODTRAN screens and the two right series the “IR Heat Loss (Background)” for CO2 only and water only respectively. The background upwelling for CO2 only and water only is very similar.
I have not found a satisfactory explanation of what these numbers represent in either the raw model output or the MODTRAN guidance, but this could be a personal problem. In any event the graphic above constrains the possibilities considerably and the common terms upwelling for “background” and downwelling for “downward IR flux” seem reasonable.
Incoming solar radiation to the planet is thought to be 340 W/m2, so the sheer magnitude of the “background”, always over 400, tells us that it must be the composite radiance of the entire atmosphere. The MODTRAN intention seems to be to subtract the downwelling from the background to get a planetary radiance for each altitude, given your selection of gasses. Below is what this looks like.
Both CO2 only and water only “net” radiation increase in intensity with altitude. in a linear way up to 5 kilometers and then begin catenary regressions to the values that remain unchanged to 60 kilometers. There is clearly something very important about the 5 kilometer level. (this figure and comment were changed 11/27 due to my spreadsheet error) If we assume this net radiance is isotropic, CO2 only would appear to cool the planet as its net radiance exceeds 340 W/m2 for most of the curve.
—————-
MODTRAN addresses the IR part of the spectrum from wavenumbers 100-1500. The sun, at 5800K does not radiate significantly in these spectra. All the energy in the MODTRAN part of the spectrum harks from the surface of the planet. The atmosphere is initially radiated and otherwise heated from the bottom up.
With this in mind it seems interesting to subtract the values of “background” upselling radiation for progressively higher altitudes from the lowest altitude in MODTRAN (half a meter). We might expect that background upwelling would diminish with altitude, leading to a steady increase in the differences. This exercise was performed for CO2 only and water only. Below are the results for the first kilometer.
CO2 was done first and the very surprising result was that CO2 differences were “quantized”. The data points were chosen to parse out the “quanta”. The stepwise progression in energy is very regular and appears to be a model increment. The stepwise progression in altitude is very irregular. The same data points were used for water. There could be quanta for water too if its data were systematically parsed at meter scale, but they would not match those of CO2. This effort will focus on CO2 and use water only for a frame of reference.
The other surprising result is that the background radiance is higher than the surface leading to negative differences for both CO2 only and water only. The background does not drop back to surface (half meter) levels until maybe 370 meters for water and 400 meters for CO2.
How can this be? How can “background” radiation that emanates from the “ground” increase with altitude?
It is very interesting in this regard that the 400 meter level where background upwelling values higher than the surface end for CO2 only, is the level we begin to see a signature of specific CO2 absorption.
Four hundred meters is the top of the “brick” for CO2 only.
Energy can be neither created nor destroyed. Neither can it be amplified without borrowing. Greenhouse gasses do not create energy. They can absorb it and transform it, but there is always a processing loss to other forms of energy. The increase in radiation above the surface could rely on energy “borrowed” in the form of downwelling from higher levels.
We can evaluate this possibility with the downwelling difference from the surface shown below.
It can be seen that downwelling differences from the surface are very linear and decline in energy with altitude. This is not promising. One would expect an increase in downwelling in the same 0-400 meter zone if it were the cause of upwelling values higher than the surface.
How can CO2 only radiation be stepwise?
The stepwise altitude progression of CO2 shows very equal increments in energy (.31 W/m2) but altitude increments ranging from 14 to 386 meters. These could represent layers with different properties, but the layers would apply to CO2 and not water.
——-
We have painted a picture of CO2 acting strangely in the atmosphere. It appears to radiate in only one direction below 300 meters; its Planck intensity up and down always matches; it shows a pronounced stepwise altitude variance with the surface; and its upward radiance is higher than the surface up to 400 meters.
What could account for this strange behavior?
Possibly unique spectral properties.

Carbon dioxide is unique among the major greenhouse gasses in having what is called a “Q branch” in the arcane. The HITRAN image next below (thanks to Barrett Bellamy) shows what this means. The central spike is the “Q” branch corresponding to the 667.4 fundamental bend. The “P” are rotational transitions gained along with the bend that reduce the energy of the molecule. The “R” are rotational transitions also gained with the bend that increase the energy. It is a package deal. You do not get the P and R without the Q, and the P and R substantially cancel out.
Similarly, in the image above it can be seen that all of the CO2 transitions are dependent on the fundamental bend or Q branch. They all spring from the first transition rather than the ground state. Another package deal. Without the fundamental bend the other transitions do not exist.
The image above also illustrates the preponderance of total energy represented by the fundamental bend. This indicates very powerful absorption. It also shows how the second order transitions are much weaker, and that all of these transitions are saturated at 280 ppm pre industrial levels of atmospheric CO2.
No light in either the first or second order bands has made it from the surface to the tropopause since the industrial revolution.
The third order transitions are in turn entirely dependent on the second order, and they are orders of magnitude weaker. Only these third order bands are unsaturated, and only these can further warm the “planet”. The saturated bands are already completely absorbed, and increasing CO2 in the atmosphere merely moves the complete absorption level closer to the surface .

The image above also shows the absorption fraction in the fundamental bend at 400 ppm CO2.It can be seen that the Q branch, on which the P and R depend, is very nearly completely absorbed in one meter.
The resolution of MODTRAN is one meter.
This may help explain the kissing conundrum and how there could be no distinct signature (the brick) looking down and a clear signal of powerful absorption looking up. The Q branch spikes “kiss” looking up and down because this CO2 band is an extremely powerful absorber in both directions; and, the entire CO2 absorption spectrum rests on its shoulders. With one meter resolution, MODTRAN can be seeing different molecules looking down and looking up, and nearly the complete absorption section for the fundamental 667.4 bend is contained in the same meter. We could be seeing downwelling energy warming the brick in the upper part of the one meter section.
The stepwise altitude progression of CO2 upwelling differences from the surface appear to describe atmospheric layers with no change in CO2 only upward background radiance. The deepest such layer extends from 14 meters to 400 in altitude. The following layer is also 14 meters to 414. Above this the steps are more regular, ranging from 69 to 88 meters. I have no explanation to offer.
The increase in upward background radiance above the surface for both CO2 only and water only is also difficult to explain. The top of this excess radiance seems to match the top of the “brick” for CO2 only, but the top of the brick for water only is much higher than its top of excess radiance, closer to the level at 5 kilometers. where both CO2 only and water only reach their maximum net radiance. CO2 and water differ in many aspects of their greenhouse behavior. Water never “kisses” up and down, for example. This excess energy phenomenon may have something to do with the intense radiative exchange between the surface and the lowest atmosphere described as the photon food fight. Kevin Trenberth’s energy budget gives this as 398 W/m2 upwelling and 340 W/m2 (same as TSI) downwelling taking place simultaneously. These numbers square fairly well with MODTRAN, which gives a background upwelling value of 417 W/m2 and composite downwelling of 348 W/m2 at one meter. Perhaps the photon food fight acts like a reflector oven.
It is widely known that global temperature is not currently following the model script. Temperature controls the variation around the trend of increasing atmospheric CO2 even today.It is widely acknowledged that CO2 follows temperature in the ice and benthic cores extending back at least several million years. CO2 does not appear to control temperature at any time scale.
The obvious and unaddressed question is, “Why not?” Hopefully this exercise provides the partial answer that we still have a lot to learn about how CO2 works in the atmosphere.
However one choses to interpret these investigations, it should be clear that the “heat absorbing” properties of CO2 (and water) in the atmosphere are not “well known” or “well understood.”


Here’s the simple reason for the “kissing” of the downward and upward emission curves: you have to understand the Schwarzschild Equation (see the section at https://www.barrettbellamyclimate.com/ ). For wavenumbers like 667 cm^-1 which are completely saturated within metres of the Earth’s surface, Kirchhoff’s law applies: a good absorber is a good emitter. So 100% absorption is followed by 100% emission. Because the temperature drops with increasing altitude, the second term on the right side of the Schwarzschild Equation decreases as altitude increase. For your spectrum at 10 km, the temperature at 10 km is approx. 235 K, and at the surface is about 300 K. Because 667 cm^-1 is near the peak of the IR black body spectrum for 235 to 300 K, the emission at 235 K will be approx. (235/300)^4 = 0.38 times that at 300 K, where we have used the 4th-power of temperature function of the Stefan-Boltzmann law. Using a mm ruler to measure distances on your spectrum, the emission at 667 cm^-1 corresponds to about 0.48 emission units; 0.38 times 0.48 units equals 0.18 units. Now compare this with the interpolated value of the height of your blue peak = 0.19 emission units (essentially the same). The two curves kiss because the emission in both the upward and downward directions come from a thin opaque layer with molecules at the same temperature.
There is much more I can send you if you contact me at rtaguchi@rogers.com (this is a shortened 2nd version of my response to you; I inadvertently wiped out a much longer response and I am not in the mood to retype it again).
Roger, thanks for the thoughtful reply. The problem with the Schwarzschild equation is that it uses the absorption coefficient in both the sink and source functions. This assumes that Kirchoff applies and the emissivity is unity.
While everything with a temperature radiates to some degree, material properties differ in the tendency to spit photons; or continue to rotate, bend, or stretch. The highest published emissivity I have seen for CO2 is .19 (Staley and Jurica 1972) for a 1 meter slab. One meter is pretty much the optical depth at 667.4.
Of course, all of this rovibrational energy CO2 stores rather than emits can be transmitted kinetically to other molecules in the atmosphere; which then radiate according to their own properties. CO2 and Nitrogen also have the special relationship shown below.

It is also interesting that while at 10km the 667.4 spikes reach out to each other:

At higher altitudes the upwelling spike inverts, and at 40km the passion ends with inverted upwelling spurning downwelling’s frantic yearning to kiss:

Hi gymnosperm! I am responding several months late because I had not seen your reply post of Sept. 8 until a friend, Peter Ridley, informed me in an email yesterday.
The Schwarzschild Equation equation does not assume a Planck black body radiation spectrum, so the term emissivity of CO2 (or any other greenhouse gas) ought not to be used. Instead, we have to apply the Schwarzschild Equation to any frequency (line or band) of interest.
The v=0 to v=1 bond bending absorption band of CO2 is so strong that complete absorption of most of its lines occurs within metres or hundreds of metres from the Earth’s surface. However, by Kirchhoff’s law, that complete absorption is followed by complete emission, so the NET absorption is close to zero in the first tens of metres.
Then why can we observe absorption spectra of CO2 that are well-replicated by MODTRAN computer simulations? Because normal lab absorption spectra are obtained using a warm black body source of infrared (IR) radiation; a very good approximation would be a well-insulated oven with a small hole in its wall, out of which the IR photons stream. Thus the initial intensity, Io, is high compared to that of the 288 K Earth. For example, at 576 K, the Stefan-Boltzmann T^4 law says that the flux will be 2^4 = 16 times that at 288 K.
The coefficient for the second term on the right side of the Schwarzschild Equation B, would correspond to the emission at 288 K, a factor of 16 times smaller.
However, for photons emitted by the 288 K solid and liquid (hard deck) surface of the Earth, Io corresponds to 288 K, and so would be approximately the same as B until the temperature drop with altitude becomes significant. Hence the CO2 “emission” at 667 cm^-1 will be very close to that of the 288 K Planck black body emission from the Earth until the altitude becomes significant.
Your experiments with MODTRAN show this. At 10 km, B/Io can be approximated by (220/288)^4 = 0.34 since the CO2 absorption/emission band occurs close to the maximum of the Planck emission curves for these temperatures.
At frequencies outside the CO2 band, the dry air itself (N2, O2, Ar) does NOT absorb OR emit any significant amount of IR radiation (because the molecules are non-polar, so there would be no changing electric dipole moment). Therefore a spectrometer looking upward would see only the CO2 287 K downward emission band, with none of the other frequencies that make up the spectrum emitted upward by the Earth itself. CO2 is a non-polar linear molecule in the ground state, but in bond-bending there is a changing electric dipole moment perpendicular to the molecular axis, so it can absorb and emit IR around 667 cm^-1. It can also absorb/emit during asymmetric stretch, but the symmetric stretch vibration is IR inactive because the net dipole remains at zero.
Looking upward from 40 km, the CO2 downward emission is very weak because the concentration (partial pressure) there is so small that the lines are no longer saturated. Therefore the peak emission no longer fits a Planck black body curve, and you cannot derive a physically meaningful “temperature” of emission. Because of the temperature inversion from 20 to 50 km caused by the absorption of incoming Solar UV and visible radiation by ozone in the stratosphere, the thermodynamic temperature is actually higher than 220 K, but the emission level is nowhere near that of a hotter Planck black body!
Re the P-, Q- and R-branches of the CO2 spectrum: The photon is a boson with spin 1; this means it follows Bose-Einstein statistics (so many photons can be in the same quantum state, as in a laser beam), and it carries one unit of angular momentum. Therefore in heteronuclear diatomic molecules like HCl, the rotation states change by 1 unit of angular momentum on absorption or emission of IR radiation. This explains the lines in the P- and R-branches of the spectrum (for HCl, see http://hyperphysics.phy-astr.gsu.edu/hbase/molecule/vibrot.html ).
The many, many lines in the Q-branch are formed when J, the rotational quantum number does not change. What happens to the angular momentum of the photon? In the v=1 first excited state, the most probable configuration of the molecule is slightly bent, so the there is angular momentum from the rotation of the three atoms around the equilibrium linear axis of symmetry. Note: the tip of the Q-branch is much higher than the tops of the P- and R-branches because it is made up of many, many (20 or so) very close lines (see what happens if you add 20 Gaussian bell-shaped curves separated by 0.02 standard deviations from each other). The tip of the Q-branch CANNOT be used as a “temperature” probe to deduce the “temperature of emission” and therefore an “altitude of emission”, despite what you might read in textbooks on the physics of climate change.
For the Schwarzschild Equation, see http://www.barrettbellamyclimate.com/ . Hope this helps. For more detail and explanation, contact me at rtaguchi@rogers.com .
Hi gym,
In Oct. 2015 one of your readers commented aboyt your credibility and invited you to disclose your credentials (https://geosciencebigpicture.com/about/#comment-4648). Your response could well be genuine, considering how you responded to retired science teacher Roger Taguchi’s comment here.
I respectfully suggest that you take up Roger’s offer of E-mail to Over the past 10 or more years he has been involved in trying to enlighten some very well qualified individuals who had misinterpreted the impact of increasing levels of atmospheric CO2. In the process he has put together a very detailed set of analyses which should help you properly understand what those MODTRAN plots are telling us.
BTW, Roger, who earned a degree in Chemistry, undertook post-graduate research under Dr. John Polanyi (http://www.nrcresearchpress.com/doi/abs/10.1139/v70-490) who won the 1986 Nobel Prize in Chemistry, for his research in chemical kinetics
Best regards (and Kaisen),
Pete
Thanks Pete. Roger is correct in his comment on why the up and down curves kiss in the troposphere. At higher altitudes the fundamental bend stretches away from its rotational sidekicks to maintain the kiss. This 667.4 band is .98 absorbed in one meter at 400ppm. One meter is the limit of MODTRAN resolution.
Roger’s response got into the Schwarzschild equation and I did respond to him that I objected to the use of this equation in regard to CO2 radiance because CO2 has very low emissivity (~.2) . The equation uses emissivity of 1 in both source and sink functions. This is close for the atmosphere as a whole, but way off for CO2 specific radiance.
I heard nothing further from Roger, but I will email him right now.
Hi Gordon,
During discussions years ago on the blog of an Austrlian senator I recall Dr. Jinan Cao having to point out that emissivity is wavelegnth dependent. He also alludes to it in his 2012 article at (http://joannenova.com.au/2012/09/do-greenhouse-gases-warm-the-planet-by-33c-jinan-cao-checks-the-numbers/.
Roger puts it this way ” .. The extinction coefficient/absorptivity in the Schwarzschild Equation is wavelength dependent, so the value of I = Io.exp(-KCL) + B[1 – exp(-KCL)] should be calculated for each line or small frequency range .. “.
Best regards, Pete