
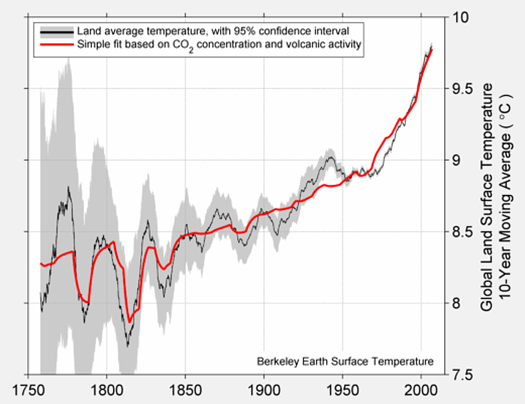
Temperature, CO2, and volcano data | More recent data | High-resolution image The annual and decadal land surface temperature from the BerkeleyEarth average, compared to a linear combination of volcanic sulfate emissions and THE NATURAL LOGARITHM of CO2. It is observed that the large negative excursions in the early temperature records are likely to be explained by exceptional volcanic activity at this time. Similarly, the upward trend is likely to be an indication of anthropogenic changes. The grey area is the 95% confidence interval. (Capitals mine)
The graphic above has been widely used to establish a relationship between human CO2 and temperature. I was unable to replicate it. Stephen Mosher very kindly steered me towards a link on the Berkeley Earth site with an excel sheet.
Using their spreadsheet I first analyzed the components.
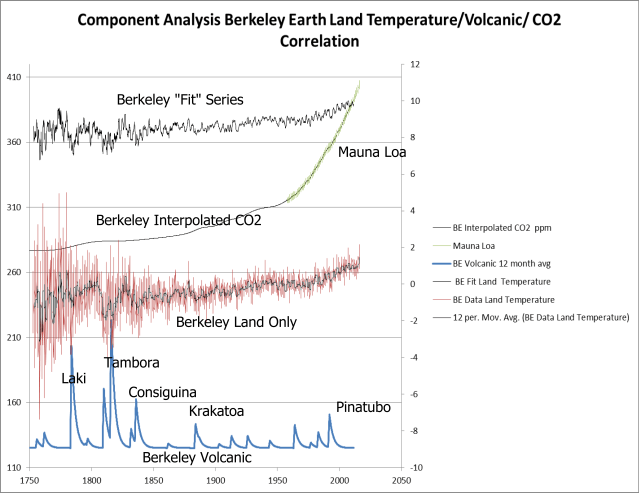
The volcanic correlation is interesting, but a very large negative temperature excursion in 1758 seems unsupported by major volcanism, and many temperature drops seem to have begun before the corresponding volcano.
There is certainly no important correlation (.46) between CO2 and the Land Only data. So I wanted to see how the correlation in the Berkeley Earth graphic was achieved. We are given an equation for the “fit”: Fit = alpha + beta * log( CO2 / 277.3 ) + gamma * Volcanic. The values of the parameters are given as:
| alpha: | 8.342105 |
| beta: | 4.466369 |
| gamma: | -0.01515 |
It is well known that there is an approximately logarithmic diminution in transmission as CO2 in a jar is increased, so a logarithm is a reasonable place to look for getting CO2 in line with temperature.
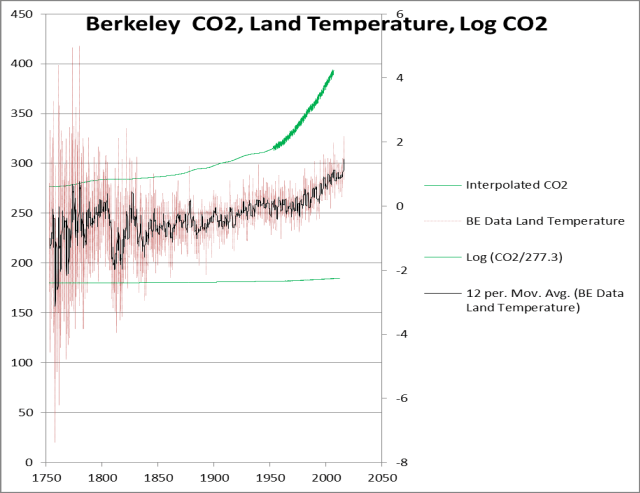
You can see that the log of CO2 is no fun at all. It is way too flat. We are given the common log, not the natural log, so we take this as a error in the caption of the Berkeley graphic.
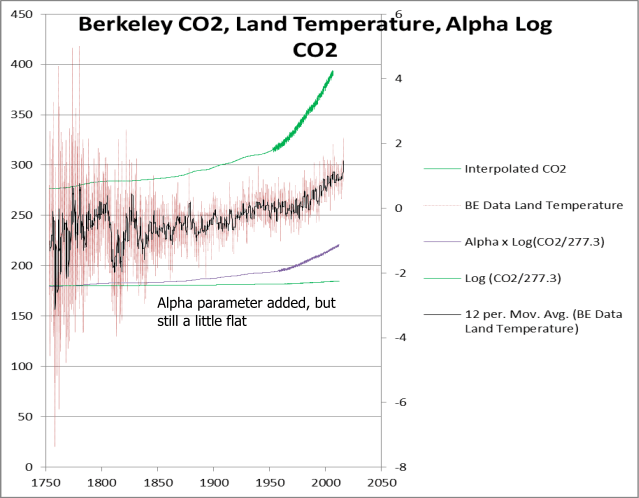
I know, let’s add a parameter. We hear a lot about parameterization, but rarely get to see it in action. Here we step through the equation one term at a time.
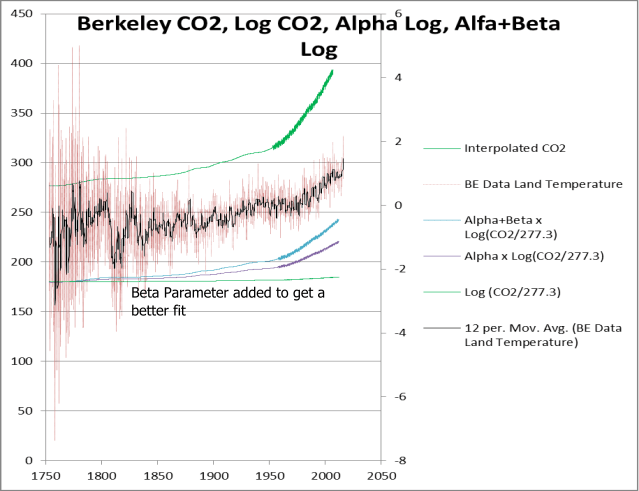
Hot damn! That’s a much better fit at the end, but there are some jagged toes on that foot.
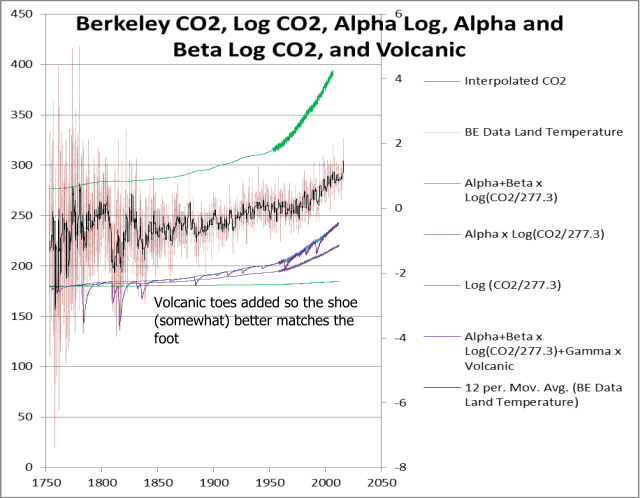
And with the volcanic parameter the shoemakers have finished their fit.
I am not at all impressed with this process. The author states the rationale:
Because the RCP estimates that most forcing time series are highly correlated to CO2,
|
He started with a preconception based on Potsdam forcing data that the correlation must be close, and felt no qualms about using tunable parameters to create a spurious correlation.
True scientists don’t run in those shoes.


