Carbon and the Second Coming

Why do we yearn the judgment day? Why is there always, on some street corner, somewhere, somebody proclaiming that the end is near?

Judgement

One must learn from their weaknesses, if possible. But this yearning keeps returning, again, and again.

We fancy ourselves children of the enlightenment, having learned dispassionate perspective from science. Yet prominent scientists revert to shamanism all too quickly.

Chains

How quickly the dioxide of Carbon has morphed from a molecule comprising 1/2500 of the atmosphere, a molecule we exhale with every breath, a molecule whose absorption spectra is already saturated by infrared light from the sun; to the boiler of oceans, the end of life on the planet.

Repent!

A truly dispassionate observer would find it amusing, but nobody is laughing.

Posted in Anthropology, Climate, Human need for Judgdment, Shamanism | Tagged , | Leave a comment

Ah, the Frogs

Almost forgot about the frogs. It has been dry, desert dry, in California for so long.

They are tiny creatures, like what we used to call “tree” frogs, but they live in the grass.

You can never imagine there would be so many.

Your presence disturbs the near ones for a bit, but you can hear the thousands, millions, in the distance as the rain patters my hat. First one, then another, nearby, then a grand crescendo…

It is finally raining in California. The frogs were waiting, waiting perhaps for the conditions that first allowed their ancestors–our ancestors–to venture on to land.

The frogs have learned to be patient, and so must we.

Posted in Biology, California Drought, Climate | Tagged , | Leave a comment

The Pacific Triangle Revisited, The Impact, The Wave

We have explored the Pacific Triangle and the Ring around Antarctica in prior posts. It just seems so outrageous that three spreading ridges would suddenly emerge from a single point in the Panthalassic Ocean 170 million years ago and begin migrating away in three directions.

Using base maps and paleocoordinate software developed by Christopher Scotese, we have been geolocating existing surface geology back in time. Our first effort has been the western U.S. and the current position of the States was held as a reference point and a launching platform for the transformations.

As we stepped through time, it became apparent that the Pacific Rise, having originated at the Triangle, was advancing on the current position of the U.S. from the west even as the true landmass was advancing on its current position from the east.

Wave

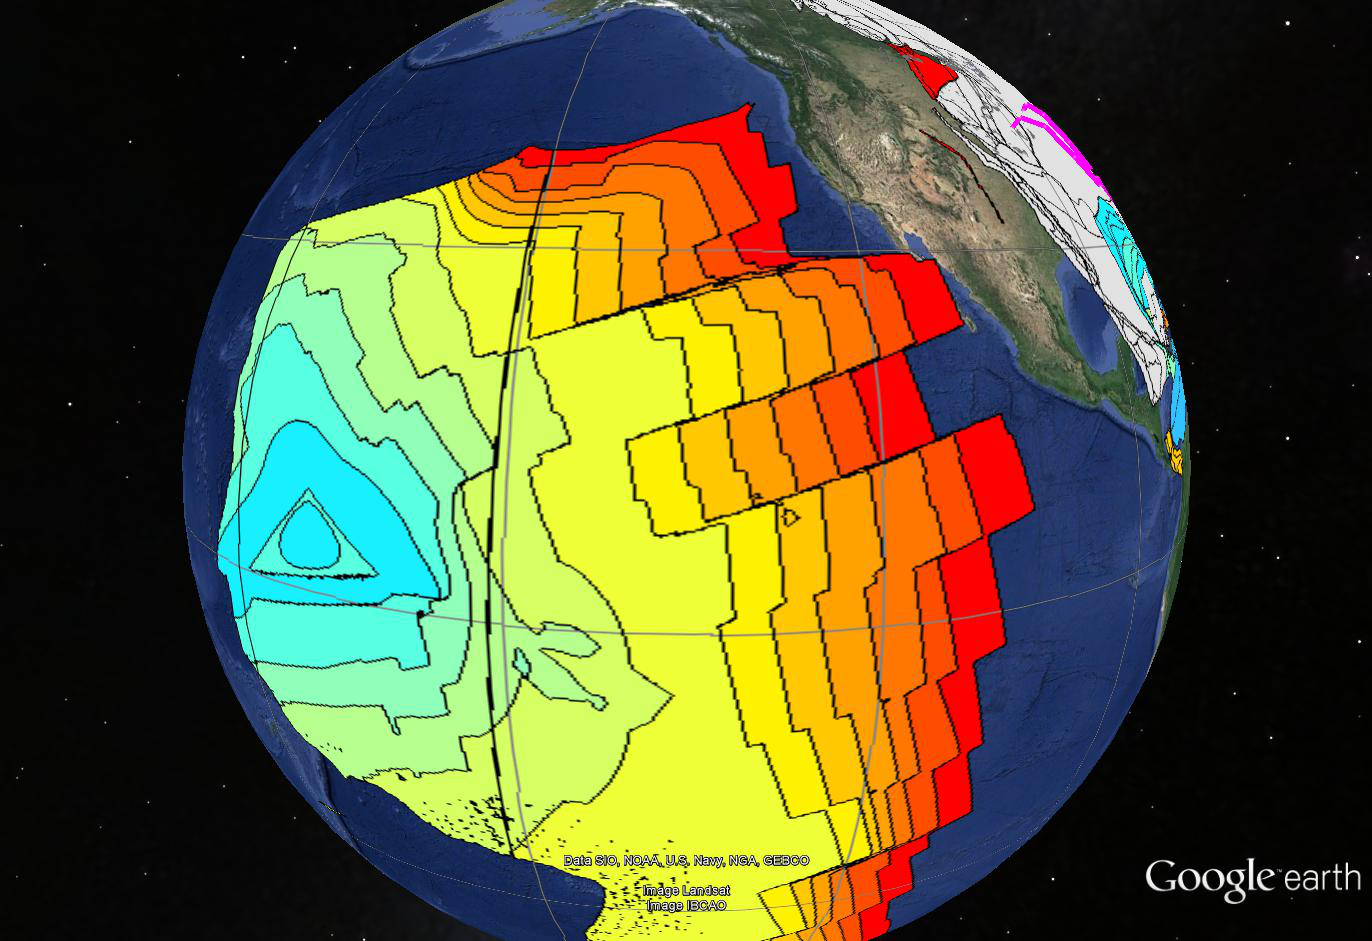
This Google Earth image shows how far the ridge had migrated from the Triangle and how much it had advanced on the current North America as of 60 million years ago(mya). It is important to remember that wherever you can see our current world in this image, there was only ocean floor 60 mya. We presume that the ridge was producing symmetrically so that there would have been a complimentary pattern of isochrons to the right (east) of the ridge, but all that ocean floor has been lost as has most of the floor west of the Triangle. There seems every indication from what little is preserved that the other two legs were producing as much floor and moving away at the same speed as the Pacific Rise.

We are going to offer here a hypothesis that the Pacific Triangle was an impact point and that the three spreading ridges represent, at least initially, a pressure wave in the mantle moving away from the impact point as the ripple in pond moves away from a  rock thrown in. We offer this knowing that there is no notion of any impacts around 170 mya. There was a pretty decent extinction event and negative C isotope excursion at about 200 mya, but 30 my seems like a long wait, even for a postulated wave travelling less than a meter a year.

We are also aware that there are no known waves in the mantle that travel this slowly.

Antarctica 60

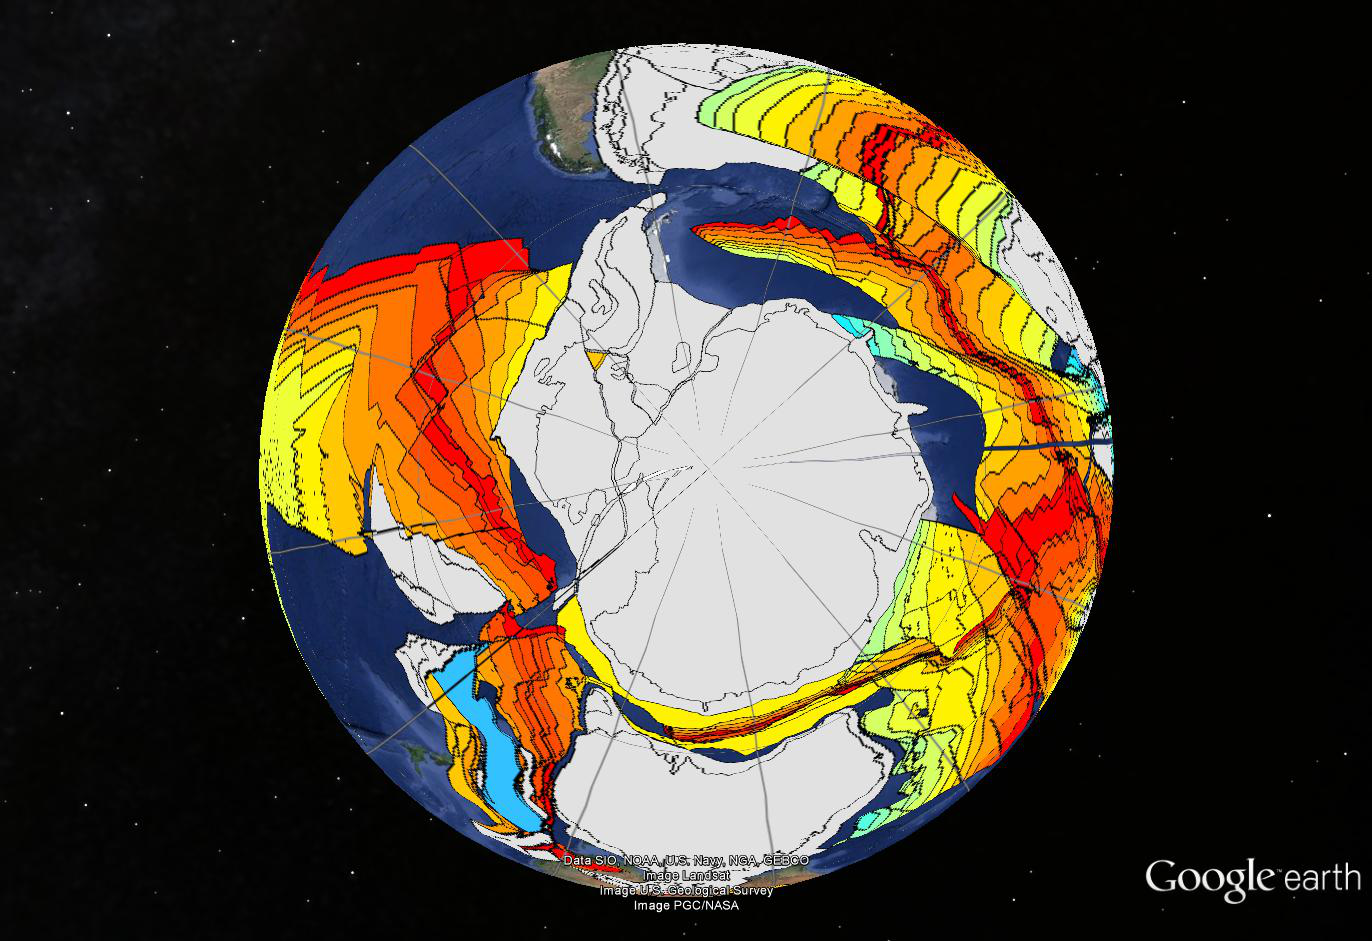
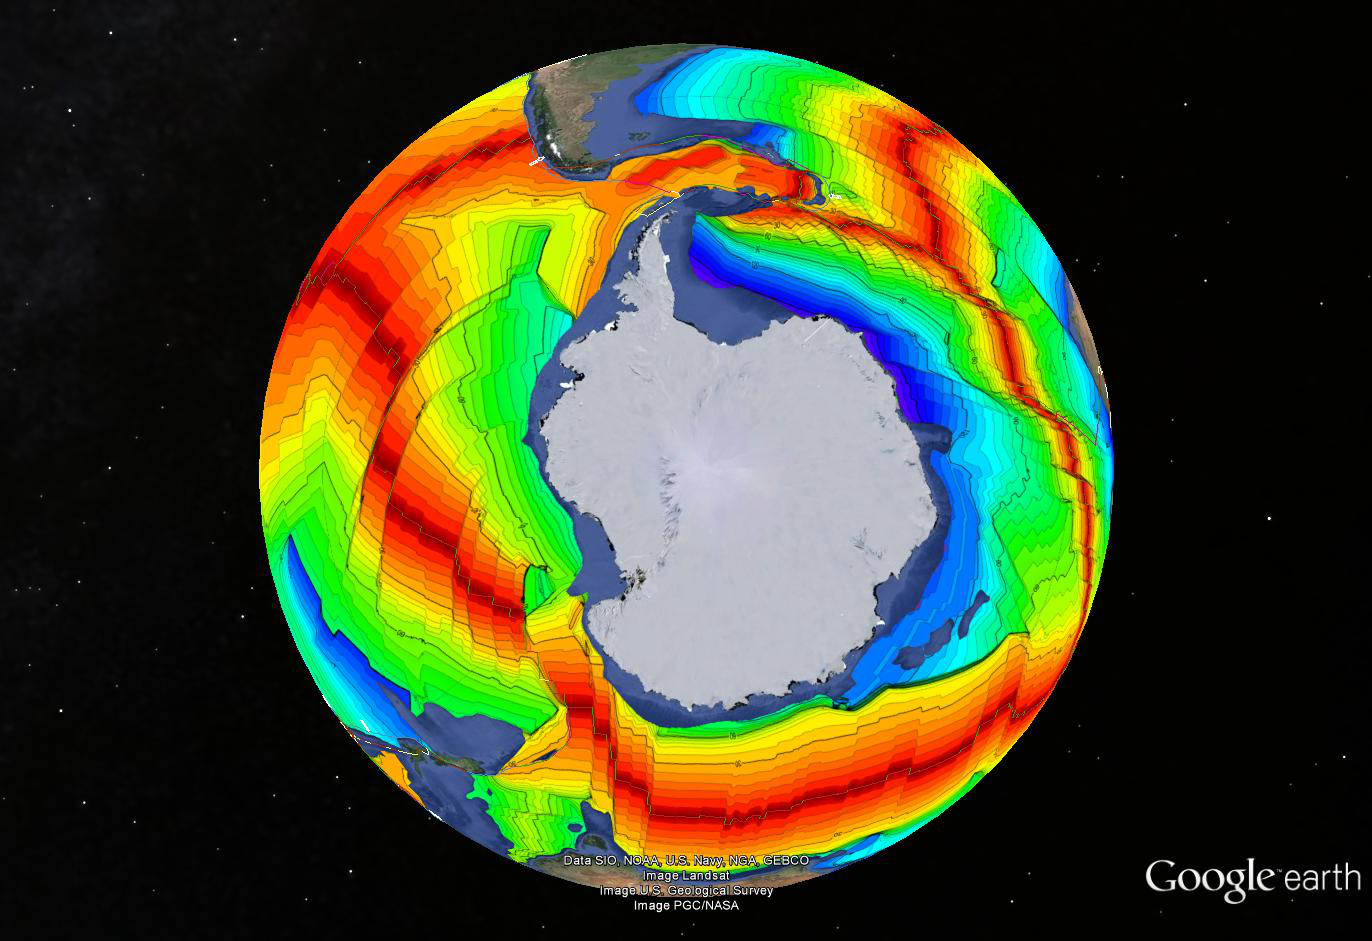
Here is the Antarctic view 60 mya.

Antarctic Current

You can see by comparing it to the identical current view that Antarctica has moved very little in the last 60 my and since there are no trenches, the ridges have necessarily moved away from it.

It seems that ridges are not fixed convective features, but rather are in constant motion. It can be seen from the wander path of the western U.S. that the westward movement is often much greater than the growth of the Atlantic ridge. What this means is that the fracturing Pangaea and the Atlantic ridge moved as a whole.

Maybe they’re all waves?

Posted in Asteroid Impacts, Geography, Geology, Pacific Triangle, Paleogeography, Plate Tectonics, Seafloor Isochrons | Tagged , | 4 Comments

A New Feature of the Pacific Decadal Oscillation?

We learn about things in mundane ways. Our conception of the Pacific Decadal Oscillation (PDO) began with fish. Salmon are absolutely delicious. Tough handed people venture into dangerous conditions to catch them for us. It became apparent to the tough handed, and lily handed entrusted to manage the resource alike, that the ease and difficulty of catching these fish followed a cycle.

pdo_warm_cool3

From fish it went to this and Kevin Mantua developed an index for it. It was discovered that PDO phases corresponded to rainfall in China. The header picture of this blog is the Shen index which goes back over 500 years to when they started measuring rainfall over there. We’ve discussed various indices before.

So now we have fish, warm and cold water, and wind. All good real things we can measure. Notice how they have correlated Southern Ocean warming with what I call the Nina phase. The phases of the PDO are variously called “negative” and “positive” and “cold” and “warm”, completely subjective names whose meaning depends on where you happen to be looking from. I prefer the gender names because one phase favors El Niño’s and the other La Niña’s. There is some basis for this correlation in the Southern Ocean but it is controversial and it seems not to match the record sea ice extent we see today.

800px-PDO_Pattern

Enter the bean counters who generate the real world image above as an example of the Nino phase during a period (March, 2012) that happens to be during the current Nina regime. They did this by taking data for an anomaly, which is the difference between what is measured and an (in this case) undisclosed baseline , and dividing it by the global anomaly. This is a tactic usually used to cancel any trend, which they certainly accomplished because they were able to show a Nino pattern when the trend was strongly to a Nina phase. Maybe this shows that there is signal for both phases all the time, but I just like fish better.

animated gif

I like this one because it discloses the base period and it happens to be during the instrumental era when someone besides drunken sailors was taking the measurements. It must be remembered that satellite measurements of sea surface temperature did not begin until 1981.

This hot spot on the end of the classic Nina tongue of warm water in the North Pacific has not been in the program. It’s seeming correspondence with the record-breaking drought in California makes it all the more interesting.

Posted in California Drought, Climate, Geography, San Francisco Rainfall | Tagged | 3 Comments

Some Things We’ve Noticed About the California Drought

California is a drought state. Our so called “Mediterranean” climate falls in a global zone just poleward of the great deserts and along the western continental margins that is characterized by winter rain and summer drought.

Should we be surprised when sometimes rainfall extends into summer months and summer drought extends into winter?

The 2013-2014 rainfall season has just set a new record in San Francisco, the location with the longest continuous record. This record extends back 164 years to 1850. We believe the current California climate has been in place for about ten thousand years since the most recent ice advance receded, and probably for about two million years intermittently during the “interglacial” episodes like we live in today. Statistically, a 164 year sample has a low probability of representing what is “normal”.

anomalygs_6m

This is a six month sea surface animation beginning in August, 2013. We can see that there is an unusual amount of extremely cold water upwelling off Baja California beginning in August and extending north during the “winter” months. The fish love this because it brings up lots of nutrients including Carbon from the deep ocean, but this pattern removes the areas of warm surface water that fatten the clouds with rain.

animated gif

You can see this “hot spot” of ocean temperature in the previous animation but it shows better in this projection. For perverse reasons only NOAA would know, this animation will not run. In various configurations this has been around since August.

z200anim

This animation is from 12000 meters at the very top of the atmosphere and the bottom of the stratosphere. Essentially, we are looking at areas of warm air rising and “denting” the bottom of the stratosphere and “sinkholes” where the stratosphere is warping down. One such downwarp can be seen causing the misnamed “polar vortex” that caused the recent cold wave back east.

We have noticed that a red dot seems associated with dry spells in California, and we are especially interested in the possibility that this dot is associated and offset east (leeward) from the hotspot in the ocean below.

Posted in California Drought, Climate, Geography, Oceanography, Paleoclimate, Relationship of SST and 200hPa Anomalies, San Francisco Rainfall | Tagged , , , , | 1 Comment

Carbon Dioxide, the Wimp

It is pretty well-known that CO2 represents only one part in 2500 in the atmosphere. Water vapor represents one part in 40. Not only is CO2 a wimpy constituent of the atmosphere, it is also a wimpy constituent of the green house gasses.


I was looking at this Wikipedia graph of the solar spectrum for another project. It shows the bands and energy levels with notches in the radiation at sea level where greenhouse gasses absorb the incoming radiation. I took the liberty of filling the water absorption notches blue to highlight them. I highlighted CO2 green.

These very same bands operate in reverse on the earth’s reflected radiation back to space, giving us in aggregate half of our greenhouse effect. What can I say? CO2 is a wimp!

P.S. 2-21-14:

Took a notion to digitize the graph above. Scaled the red area of solar insolation to 1. The blue water absorption holes have an area of .15. The Green CO2 absorbtion area is .005. The units on the Y axis are watts per square meter. Wikipedia says “direct” sunlight reaching the surface is 1050 watts/square meter, but when you add in “indirect” it goes up to 1120. It is not clear if this extra 70 includes back radiation from the greenhouse gasses.

Let’s just call it 1120. By our ratios above we get 168 watts/square meter from water and 5.6 watts/square meter from CO2. Together they amount to 174 watts/square meter absorbed by “top down” radiation. This absorption warms the atmosphere.

When you look closely at the graph that some of the bites out of the spectrum by greenhouse gasses go all the way to zero and some do not. When you point a meter at the sky and some light gets through in a green house band the band is saturated and allowing some photons through. It is also reflected photons. Your meter can’t tell the difference. When your meter reads zero in a band,  you have a black hole kicking gas and taking names.

This is where the incoming greenhouse effect is really strong. The H2O bites around 1300 and 1900 microns are not saturated. Carbon dioxide is.

Posted in Climate, Global Warming, Optical Material Properties | Tagged , , | 16 Comments

A Very Dry Season in California

The pre-Columbian California native people had a mystical and cultural relationship to the climate that did not involve measuring rainfall. The Franciscan fathers were on their own spiritual quest, and while they sometimes recorded wine production at the missions, they didn’t record the rainfall either.

The first rainfall measurements for the golden state were in 1850 when a couple of doctors who accompanied the gold rush began recording rainfall in San Francisco. One hundred and sixty-four years is a paltry database to gauge what is normal for a climate that has been around for the last ten thousand years, but it is all we have and we use San Francisco because it has the longest continuous record.

In 2011 we became concerned about drought in California and we started a graph of the driest years. Our interest waned as a reasonable amount of rain fell in February and March of the 2011-2012 season.

2013 Rainfall

As you can see the 2013-2014 season is on track with the driest two previous years. It is tracking almost perfectly with 1850, much as 2011 tracked with 1897 until February. The driest year through December remains 1917.

Posted in Climate, Geography, San Francisco Rainfall | Tagged , , , , | 1 Comment

Photon Food Fight

The fact that more energy cycles between the surface of the earth and the atmosphere than the earth receives from the sun strikes me as one of the great marvels of nature.

NASA Budget

This is the earth’s energy budget according to NASA. You can see that while only about half of incident solar radiation at the top of the atmosphere is actually absorbed by the surface due to reflection and direct absorption by the atmosphere, nearly one and a half times incident solar energy is sent from the surface back up between radiation, evaporation, and convection.

This would be a prescription for deep freeze if the atmosphere did not send the equivalent of all the sun’ s energy back down again.

So how can it be that  more energy cycles between the surface and the atmosphere than the earth receives from the sun?

It boils down to water. Water just luuuves long wave radiation, commonly called infrared. It doesn’t care a fig for visible and ultraviolet light. Ice and water vapor are essentially the same, they absorb and start flinging (radiating) long wave photons every chance they get. It is just a material property of H2O.

To get things started, clouds, water vapor, and ice absorb long wave photons from the sun and start flinging them every which way, up, down, sideways. The ones flung down by the atmosphere and whatever few make it through from the sun hit the ocean and the land. Oceans cover seventy percent of the planet, and they love long wave photons  so much they absorb them all within a few microns of the surface and begin flinging them as well.

The photons the ocean surface flings down (say half) are themselves absorbed within microns. This is a losing game and all the photons are essentially contained within the first few millimeters and the net effect is that the ocean flings the photons back at the atmosphere.

The photon food fight is on. It continues day and night. Simultaneously, endlessly, a sun quantum and more.

Posted in Climate, Energy Budget, Photon Food Fight | Tagged , | 2 Comments

Paving It Won’t Save It (The Planet, That is)

The oceans are the energy bank for the planet. They receive energy to great depth from the sun. Continents cool the planet.

Daedalus suggested in jest that if we increased the area of the continents 5%, we could reverse the supposed effect of doubling atmospheric CO2.

Quite a construction project, but one that has been ongoing since the first continents were distilled four billion years ago. My suspicion is that the first continents were “large mud provinces” from mud volcanoes.

Photo Credit Ted Cross

Photo Credit Ted Cross

This is a lovely one spewing serpentinized mud. More serious continents began to form when there was enough water to hydrate granite. Granite and serpentine are too light to sink back to the mantle. Continents have been steadily growing at the rate of a bit less than a square kilometer a year since the Proterozoic.

Paving indeed. Yet temperature has not decreased steadily over the last 2.5 billion years. It has been a roller coaster ride between glacial periods and thermal maxima with no clear trend.

I sound like a Carbon wag when I say that two of the hottest periods in earth history have been in the last 250 million years. (Triassic and Eocene)

Posted in Climate, Geography, Geology, Global Warming, Plate Tectonics, Serpentine | Tagged , , | Leave a comment

Science and Government

We have become so accustomed to science by public institutions of higher education, and publicly funded science at private institutions , we easily forget that a century and a half ago this practice was unheard of.

220px-Charles_Darwin_seated

Charles Darwin was a man of some means who could quit medical school and sign on for the voyage of the Beagle. Beholden to no one, he refined his concept for a quarter of a century before publishing it. “Peer review” was written correspondence with colleagues. Darwin corresponded with Charles Lyell for decades about his thesis. “Publication” was an arrangement with a printer for some copies.

Contrast the modern arrangement where a few sanctioned journals with rigid peer review policies charge the public for the privilege of reading the results they have paid for. Where the same journals and their reviewers frame the scientific agenda and dumbed down press releases to the media. Where “publish or perish” requires young investigators to tailor their work for short time frames and conformity to the paradigm.

Before the twentieth century, science was not done at public institutions. It was done at private institutions and by private patronage. We have turned science into a government industry, and governments do not do industry well. By forcing our investigators to beg for public grants, we open the door for political control, and we beggar science.

Posted in Beggaring Science, Climate, Government Industry | Tagged , , , , | Comments Off on Science and Government