
You get the idea that nobody thinks about weather stations. Budofcourssse, with futbol and all the other distractions this should really not be surprising.
The fact remains that weather stations are ergonomically designed louvered boxes designed to be opened and the instruments read at about the height of the human nose.
Nothing wrong with that. Just that we have a surface temperature record before satellites (and after) on land that registers at the height of the human nose.
At sea it is different. Originally the thermometers were probably at human nose height on the decks of ships which were more than five feet above the ocean surface. Corrections have been attempted for this. Then there were buoys, which may or not have been five feet off the surface.
In neither case is the distribution of measurements even or representative of the planet surface. Once again the measurements are tailored to human specifications of where we prefer to live or travel.
Satellites are different. They have their limitations, but they measure everything. Not where we live. Not where we travel or do business. Not just temperature at the height of our noses. Everything.
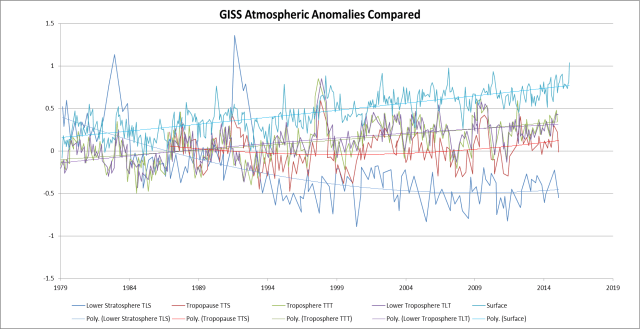
In the graphic above the top curve is the much adjusted and interpolated latest version of the Land and ocean surface data (our noses).
Moving down the two and four kilometer tropospheric data (TLT and TTT respectively) are barely distinguishable.
Moving yet further down in red is the top of troposphere (TTS) at about 10 kilometers.
The bottom curve is the lower stratosphere (TLS) at 17 kilometers.
The trend lines are second order polynomials and it is interesting that the human nose (surface) temperature trend is linear even as polynomial. The TTT “total” troposphere at 4km is linear as well. The “lower” troposphere at 2km is slightly declining as polynomial, but the two are indistinguishable as linear trends.
When we get to the upper troposphere and lower stratosphere we see a very different story. Near the tropopause, a shorter time series, shows a slight polynomial increase not significantly different from a zero linear trend. The lower stratosphere shows a stabilized decline.
The two big stratospheric spikes are the volcanoes El Chichon and Pinatubo. These register at the tropopause as well but not in the lower levels.
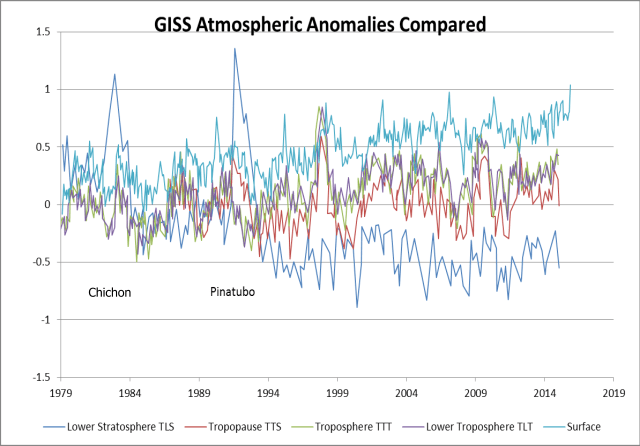
Conversely, the strong el nino of 97/98 registers strongly from the tropopause to the surface, but only manages a half hearted spike in the lower stratosphere.
It should be evident that the only metric that shows a significant trend since the turn of the millennium is the one at our noses. We will explore the reasons for this in the next post.


