
The greenhouse effect is poorly named. Nothing about it even vaguely resembles the protective shield of a greenhouse. The effect is about the florescence of certain gasses in a discontinuous fashion according to their individual spectral properties. When they shine, they warm the atmosphere.
It is very hard to graphically represent the greenhouse effect because the incoming and outgoing spectra cover large ranges on different axes. The result in the center top image below has a “golden Mean” aspect ratio, but we won’t go there…
The total energy of these radically different spectra is equal, even though incoming solar radiation has enormous power over a narrow range, and earth spectra has relatively low power over a very broad range.
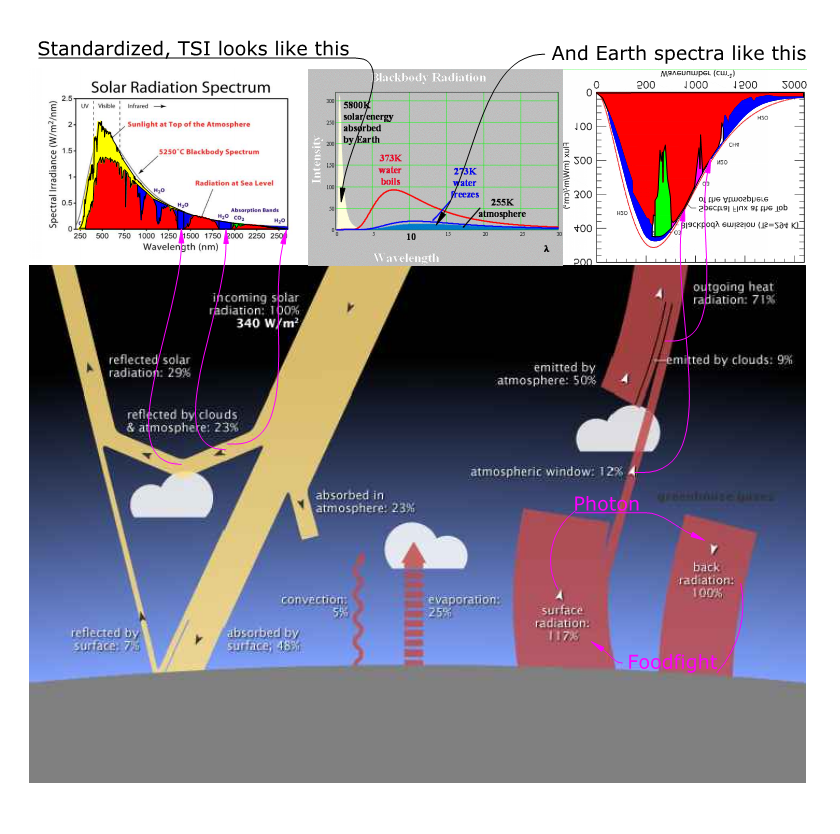
Approximations of the spectra in relation to the blackbody curves are displayed red with the greenhouse absorption bands green for CO2, blue for H2O, and magenta for O3. Carbon dioxide enjoys a position near top dead center of the power spectrum for outgoing radiation that no greenhouse gas occupies on the incoming side. H2O overlaps top dead center on the output side as well.
The entire earth output spectrum is saturated. This does not mean that adding more greenhouse gas has no effect. It means that adding more light has no effect. This may be a reason fluctuations of solar intensity seemingly make little difference.
The reason the output side is saturated and some light gets through at all wavelengths is the photon food fight. This melee is a virtual plasma of energy exchange between the surface and the atmosphere where more light is cycling than the gasses can absorb.
Not so on the input side.
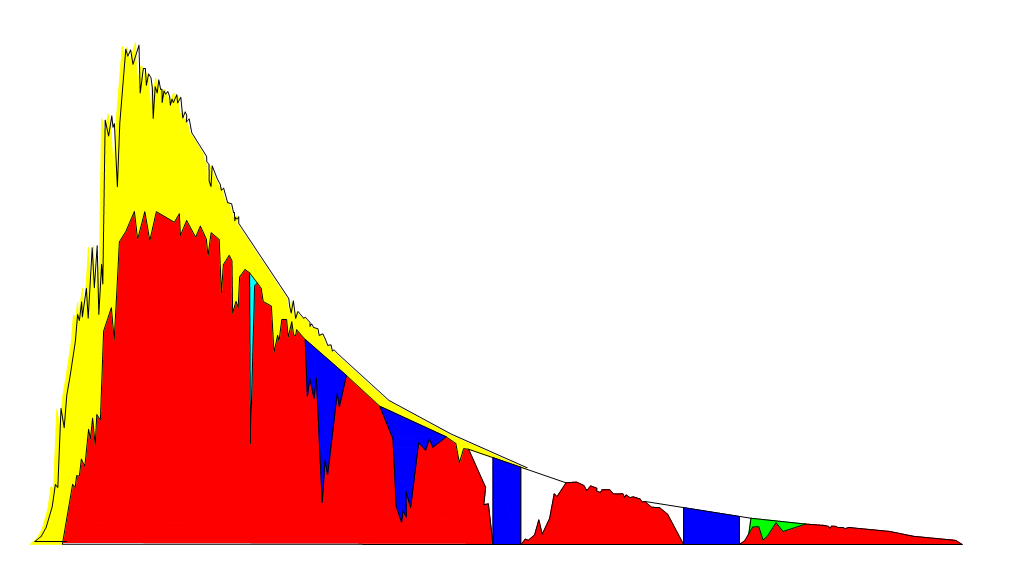
Here there are unsaturated “black hole” H2O bands where a meter pointed at the sky registers no light. Thirty percent of incoming light is reflected or refracted and may pass through these bands multiple times.
We tend to always think of the greenhouse effect as “bottom up”, but really half of it is “top down”. The unsaturated H2O bands on the incoming side will be sensitive to changes in insolation. The outgoing bands busy with the photon food fight will not.


Pingback: Everyone Loves Lists, Should We Worry or Not? | geosciencebigpicture
This post is meaninlgless rhetorical nonsense like “photon food fight”. None of the claims have any quantitative support.
You have to understand the process first or numbers become meaningless numerical nonsense. Qualitative and quantitative with enormous error bar support comes from the likes of Trenberth’s energy budget.
Nobody likes to think about the photon food fight because it is so weird. More energy than TSI zapping between the surface and the lower atmosphere at the speed of light.
Essentially, you have your head up your maths.
The arrows pointing to the top left graph should be coming from the “absorbed by the atmosphere (23%)” part. It says so in that very graph: “absorbtion”.
It does not matter much whether the atmosphere or the surface absorbs the sun light because convection dominates heat transfer in the atmosphere.
I suppose I should stop reading your blog, it is too much of a headache. The other alternative science blog I visit has really fun claims, at least, like that Venus is almost entirely geothermally heated or that you have to adapt temperature reconstructions massively to account for changing average latitude in the data.
Disclaimer: Obviously, I am just a random idiot on the internet, so add the weasel words in my claims yourself in your mind. 😀
Nature is a headache for us naked apes. According to Wein’s Law, radiation takes place in all directions (anisotropy) equally with absorption. The important differences are temperatures and spectra according to the material properties of the absorbing/radiation material. These properties vary immensely between atmospheric gasses and the: water, critters in the water, vegetation on land, ice, sand, rocks, and dirt; that comprise the planet surface.