
One of the arguments one hears often these days to explain the lack of lower atmospheric warming for a human generation is that the ocean is somehow absorbing the “heat” or enthalpy that Carbon dioxide is supposed to be creating in the atmosphere. This argument has a large number of failings straight away since the infra-red back radiation produced by this friendly dioxide can only penetrate a few microns into the ocean surface; the oceans are extremely thermally stable and stratified with the 80m warm mixed layer very happy to stay on top of the colder layers below; and the way our planet generally works is that the sun warms the surface (70% ocean) and the surface warms the air.
Kevin Trenberth published an absurd paper a while back (Balmaseda et al, 2013) claiming that the piling up of warm water in the western Pacific prior to an el Niño somehow injected this water deep into the ocean. Our response was that whatever mysterious energy source could force this warm water down against the thermal gradient would in itself explain the missing heat.
With the backdrop of this sort of foolishness it is a great pleasure to be able to respond to a recent paper, Chen and Tung (2014), whose authors actually have a clue how the planet works and have put their fingers on a mechanism that actually can transmit substantial amounts of enthalpy into the deep ocean. That mechanism is salinity and the thermo-saline sinking of super cooled and super dense salty water at the edges of sea ice where rejection of brine from the freezing process tips the density to a point where warmer water will sink.
Their analysis of this process is correct and they provide interesting evidence that enthalpy is being transmitted to at least 2000m in the north Atlantic and the Atlantic portion of what is now called the Southern ocean. Unfortunately, they have cast this impressive bit of work as yet another apology for the lack of atmospheric warming when there is no logical connection between the heat being sunk and the atmosphere. The areas where this saline subduction occurs are extremely small in relation to the surface of the planet and generally remote from the areas where air temperature is high. The atmosphere would be very hard pressed to focus enough energy on these small areas to cool itself. It seems far more likely that the energy being sunk is solar warmed surface water from the Indian and Atlantic oceans whose waters account for all of the average ocean warming since the millennium.
Almost all modern temperature data for the oceans and atmosphere are expressed as anomaly, or deviation from some baseline. There are good reasons for doing this, but in doing so one loses any sense of the relationship between absolute temperatures of the ocean and the atmosphere. By way of rebuttal, we offer here an analysis of the absolute temperatures of the water and lower atmosphere in the areas where this saline subduction is shown to occur as well as the rest of the oceans.
Proponents of human warming are very fond of citing their knowledge of the optical and physical properties of Carbon dioxide as if this tiny bit of physics alone could explain how a gas that represents less than 10% of the resonating molecules in the atmosphere and whose absorption bands are 50% saturated could accomplish such magnificent warming between 1976 to 2000 and suddenly stop. The rest of physics argues against this and among these physics is the rule that energy flows, on average, from warmer to colder bodies.

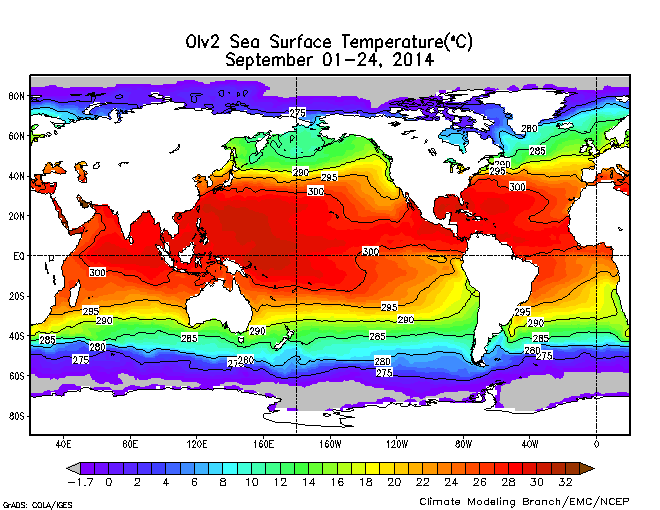
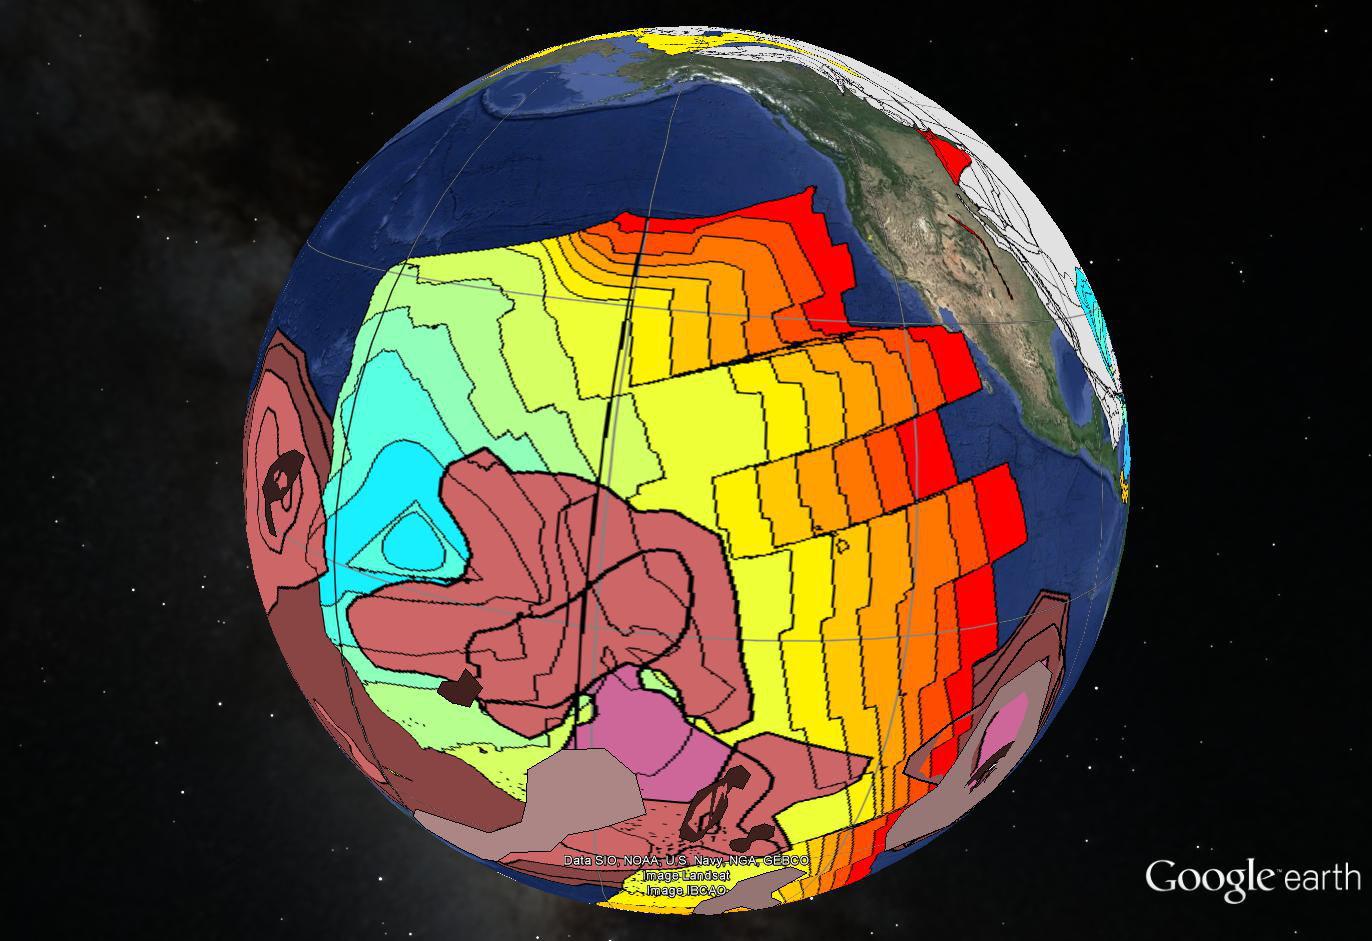
Here is the average absolute sea surface temperature from January 2000. You can see that in the Atlantic zone of the Southern ocean the temperature ranges from 0 to -1.7C as do the north Atlantic/Arctic waters north of Iceland. South of Iceland and northeastward to Scandinavia the Gulf Stream keeps the temperature much higher, maybe 7C.

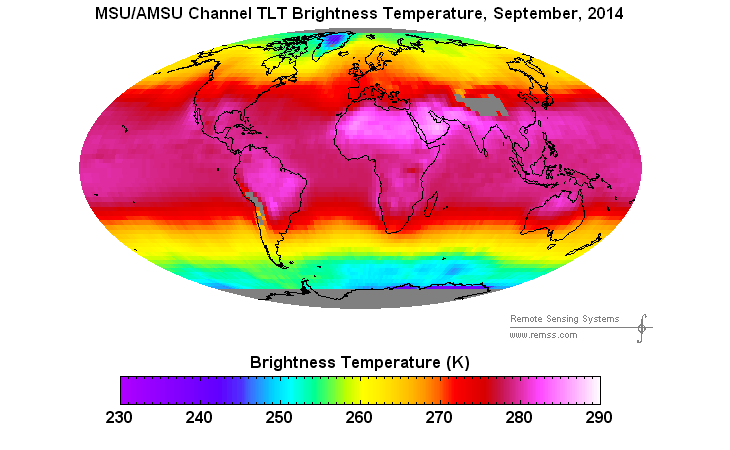
Here is the absolute lower atmospheric temperature for January 2000. It is in Kelvin so you must subtract 273 to get C. North of Iceland and in the Southern ocean the average air temperature is -17C and south of Iceland it is about -12C. These air temperatures are 10-15C lower than the ocean below. Energy is flowing from the ocean to the atmosphere even in these saline subduction regions. Furthermore, the same relationship holds for all ocean areas with the tropical ocean temperatures being 20C higher than the atmosphere above.
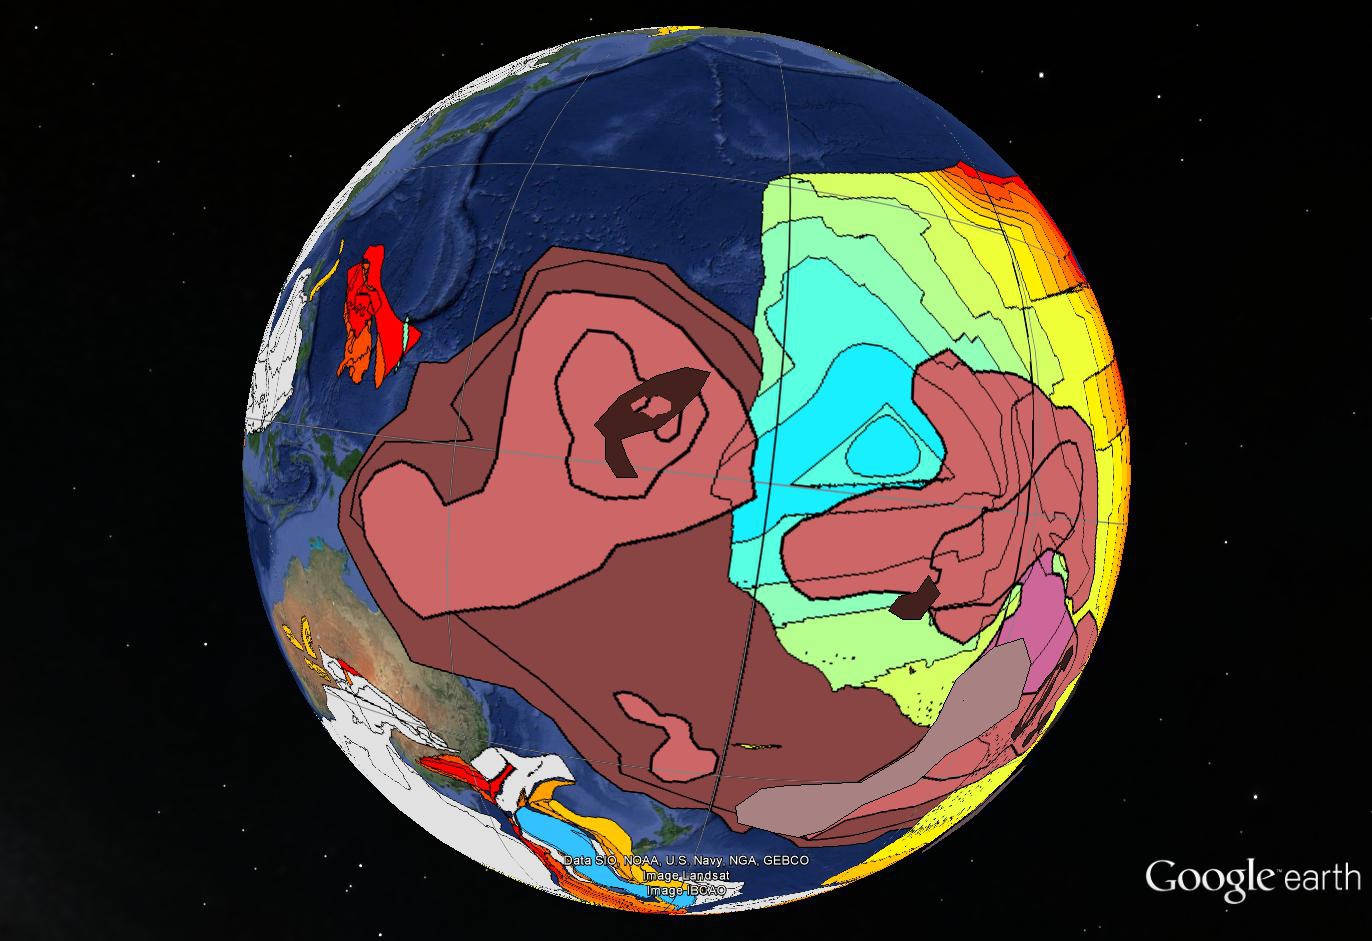
Here we skip to the other extreme in the fourteen year range explored by Chen and Tung.
We are not going to bore you with 168 examples of the monthly differentials for the fourteen year period, but without exception the absolute atmospheric temperature above the saline subduction areas as well as all ocean areas has been lower than the absolute ocean surface on a monthly average basis.
If Chen and Tung will argue that the ocean heat content increases they have shown from 2000 to 2014 represent heat lost to the atmosphere they will need to show where and how this energy transfer would occur. Would it be sensible heat? Latent heat? Qnet? Would there be tunnels of energy flow masked in the monthly averages? Would a bottom layer in the lower atmosphere somehow transfer energy to the ocean in a fashion masked by the entire profile?
We do not have data to answer all of these questions, but it is very clear that the net energy flow on a planetary basis is from the ocean to the atmosphere. It is also very clear that Carbon dioxide cannot warm the ocean without also warming the atmosphere. The lower atmosphere has stopped warming. If we are to believe that increases in ocean heat content represent sequestration of atmospheric enthalpy alleged from exponential increases in human CO2, a real time mechanism for energy transfer from the atmosphere to the oceans must be shown. That effort is all the more difficult when the ocean is warmer than the atmosphere.
The ocean didn’t eat it.


![IMG_0541[1]](https://geosciencebigpicture.com/wp-content/uploads/2014/07/img_05411.jpg)
![IMG_0546[2]](https://geosciencebigpicture.com/wp-content/uploads/2014/07/img_05462.jpg)
![IMG_0585[1]](https://geosciencebigpicture.com/wp-content/uploads/2014/07/img_05851.jpg)
![IMG_0577[1]](https://geosciencebigpicture.com/wp-content/uploads/2014/07/img_05771.jpg)
![IMG_0587[1]](https://geosciencebigpicture.com/wp-content/uploads/2014/07/img_05871.jpg)
![IMG_0604[1]](https://geosciencebigpicture.com/wp-content/uploads/2014/07/img_06041.jpg)
![IMG_0610[1]](https://geosciencebigpicture.com/wp-content/uploads/2014/07/img_06101.jpg)
![IMG_0611[1]](https://geosciencebigpicture.com/wp-content/uploads/2014/07/img_06111.jpg)
![IMG_0607[2]](https://geosciencebigpicture.com/wp-content/uploads/2014/07/img_06072.jpg)


