Idosyncratic Isochrons, and the Cretaceous Normal Superchron

The magnetic lineations in the ocean floor were first discovered using magnetometers designed for submarine detection. These isochrons are tenets of our notion of plate tectonics, yet many isochron patterns are inexplicable by our current tectonic model.

We have previously explored The Pacific Triangle, Charybdis and the Oldest Ocean Floor, and The Ring Around Antarctica. I had occasion to be perusing the Beaufort Sea Floor recently and discovered yet another astonishing set of discordant isochrons:

The geographic North Pole is just below and to the right of the only IODP drill site at the top of the image.

The shapes of isochrons are determined by the patterns of new ocean crust formation and crystallization. The sizes of isochrons depend on both the rate of magma extrusion and the time interval between geomagnetic reversals. Realistically, the magnetic data is messy a fair amount of interpolation goes into the even spacing of isochrons. For example, it is well known that between 83 and 121 million years ago, the longest known interval without a geomagnetic reversal took place. This is known as the Cretaceous normal superchron. If you look at this interval around the globe, you will see an even spacing of isochrons. The isochrons do not represent reversals.

What we see on the floor of the Beaufort Sea is two different systems of extrusion that took place immediately before the Cretaceous superchron. To the north is a small piece of typical seafloor extrusion between transform faults. This was very slow spreading compared with the Pacific ocean floor during this period. If we zoom in and add color we see something very strange going on.

North Beqaufort Isochrons

The lightest color is 120mya ocean floor, the next lightest blue is 125mya, and so on in 5mya increments. There were multiple parallel extrusion fins, each its own miniature mid ocean ridge spreading both directions. This pattern held for 120mya, 125mya, 130mya, and less predominantly 135mya; before the transition to more rapid extrusion 140mya.

While this was going on in the North Beaufort Sea and Arctic Ocean, the South Beaufort shows its own weird extrusions roughly parallel to the North Beaufort.

In the center part of a system with more “normal” progression, there is a series of fins even more tightly packed than to the north. They are less linear, and more like individual plutons. Note the tiny sliver of 120mya to the right against the continental shelf.

There are no trenches up here to relieve the pressure.

Zooming out to where the modern spreading ridge ends unceremoniously in the Laptev Sea, we can see that this perpendicular system is discontinuous in a line of seamounts to the left that must have been a trench. This view is basically looking straight down on the North Pole.
The green to blue color contrast basically separates extrusion before and after the Cretaceous Superchron. Very little, if any, extrusion took place at the North Pole during this interval.


Posted in Cretaceous normal superchron, Geography | 1 Comment

Radiation vs the Adiabat

Amongst those who have come to realize that climate models based on radiative transfer are running too hot, there is disagreement as to whether the hot bias results from emergent complexity the radiative transfer equations have yet to include; or the irrelevance of the radiative model.

Several people, including Ned Nikolov, have impressively modeled the atmospheric profiles of the earth and other planets using only atmospheric pressure and completely ignoring radiative effects.

As discussed before, atmospheric pressure effect warming is called adiabatic warming. It literally means “without the devil”. For our purposes here, the “devil” may be thought of as radiation.

Adiabatic warming is well known in meteorology. It includes the increased surface temperatures when atmospheric pressure is high, and the warming of “Foehn” winds as they fall from higher elevation plateaus. Such winds are the root of the disastrous fire season this year in California.

Ultimately, the adiabatic effect is due to gravity.We had not found an analysis from physical first principles so we offer the following:

Note: Gordon Dressler was kind enough to point out that the diminution of gravity begins at the center of the earth rather than the surface. Accordingly, the original graphic has been replaced by the corrected one above.


It can be seen that gravity approximates the density and pressure profiles of the atmosphere, but that there is significant divergence between about 3 and 20 kilometers above 5 kilometers altitude. This divergence is greatest at the tropopause, 11 kilometers in the US Standard Atmosphere. about 25 kilometers and converges somewhat thereafter.

We wondered about entropy. Noting the density curve above, we find the following:

Entropy by Density

The entropy of the atmosphere (the number of ways the molecules can be rearranged without changing properties) correlates very well with atmospheric density, and very poorly with gravity.

We conclude that gravity may well be the predominant factor in the atmospheric profile, but that other factor(s) must be in play. Very likely radiation is one of these factors. Seemingly, the devil remains ensconced in the details.

Posted in Climate | Leave a comment

Is the Saturation of CO2 Logarithmic?

It is generally agreed by both the red and blue teams in the climate debate that the incremental effects of increasing atmospheric CO2 diminish with increasing concentration. It is often said that the reduction of effect with increasing concentration is logarithmic.

If this is the case, where we fall on the curve at ~400ppm is critical information. If we are on the steep part of the curve, additional CO2 is far more important than if we are on the long tail.

MODTRAN offers a way to evaluate the questions of whether the diminishing effect is actually logarithmic, and where on the curve we fall at 400ppm.

Logarithmic

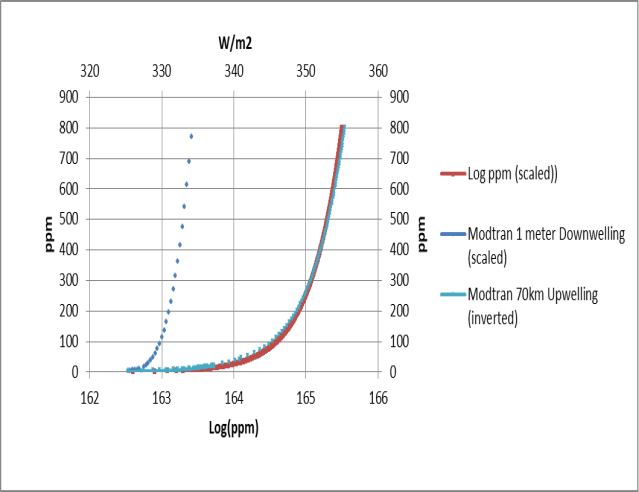
What we did here is scale and invert MODTRAN W/m2 looking up (for downwelling) at one meter and looking down (for upwelling) from 70 km. A simple base 10 log of ppm is added for comparison. Clearly, the logarithm is a very good approximation of the energy reaching 70 km as a function of ppm. The downwelling at one meter falls off far, far more rapidly.

The data was parsed tediously by noting the values for tropical atmosphere “full bore” (with all the other variables at default values) and varying only CO2. The one meter downwelling varies in “steps” of increasing length, resulting in the increasing sparseness of the data points. Seventy kilometer upwelling shows much more subtlety with every ppm having a different value, at least up to 20 ppm, where we switched to 10ppm increments to save time.

So, is the saturation of CO2 logarithmic or not?

Yes, and no…

Posted in Climate | Leave a comment

The Fire Came in the Night

The deadly fires come in the night, with the swoosh of the wind. Fingers of fire, almost liquid, reaching forward just above the ground; fireballs of mistletoe sailing high in the sky; sparks flying everywhere between.

Entropy unleashed. Potential energy gone wild. Or…simply the dragon’s breath.

Who are we to comprehend this, let alone prevent it?

A hunter’s cigarette, bad hot tub wiring, a windblown tree crashing through power lines. Errors of humans, acts of God, does it matter? The same errors or acts, absent the blow torch wind, have no issue.

That wind, and the issue have visited before.

Credit Mike Hargreaves. Only details changed since 1964. Ignition near Calistoga in Napa County, transit across the Mayacamas Mountains to Santa Rosa…if a wild assed fire chief had not stolen a bulldozer and cut broad fire breaks through what would have been houses this year, the hospital would have burned in 1964. He was lucky. The blow torch wind stopped.

The New York Times did an interesting timeline map:

NYTimesMap

By 3:AM fire trucks from Berkeley and San Francisco arrived to slow the fire’s progress at the bottom of the map…and the blow torch wind slowed. Almost on cue.

Fifty-three years is over half a human lifetime, a very long time for modern cultural memory to hold.

We built plywood houses in the dragon’s breath.


Posted in Climate | Leave a comment

River of Time

I’ve been rowing the Grand Canyon for about a month. Sixteen of us were on the river for 20 days. It takes a couple days to drive there and a couple more to drive back. It takes a day to rig and much of another to unrig.

I used to write poems more often when I was younger. Much younger.

This is what I wrote on the trip:

River of Time

When I close my eyes I see the water,
Pulsing, swirling,
Chaotic to me,

When I look up between the canyon walls,
I see the sky,
Pulsing, swirling,
Water as white clouds,
Wind that presses,

The water in the sky and in the river yearn for the ocean,
From whence they came,

We have sprung from the water,
And share the yearning,
We dance the pulses and swirls in bright artifacts,

We feel the pull of the final destination,
We know the water will reclaim us,
But we have learned that the river is the arrow of time,

We must take our temporary leave,
To dance another day.

Posted in Grand Canyon | Leave a comment

Socrates Died for our Sins

Was Socrates a troll? Maybe. He was not a diplomat. He sought no consensus.

Still, hemlock?

Given the chance to recant or drink, he drank.

Human superstition is boundless. We are not enlightened beings.

Posted in Climate | Leave a comment

Barefoot Gophernating

Barefoot gophernating is one of those senseless acts of beauty.

First of all, it requires an illegal fuel-air bomb assembly a la Caddyshack. Actually, it is not illegal as a welding rig. Mine uses a standard torch handle and propane rather than the traditional acetylene as the solvent gas. Many ironworkers use propane for cutting as well. It is cheaper and has more BTU’s.

Whenever the neighbors complain, I point to my welding rig and explain that sometimes it makes a pop.

If you have ever watched a tomato plant disappear from your garden, pulled to the subterranean netherworld by these nefarious creatures, you will understand.

This sort of terrorism demands revenge.

Enter the illegal by various Torts of nuisance gophernator.  You can blow fifty feet of gopher tunnel ten feet in the air. Even if you miss the gopher, it is enormously satisfying.

It is dangerous, like many satisfying things in life. The barefoot thing is extra spice. The directions admonish you to wear sturdy shoes. It is like brazenly standing on the second step of a three step ladder that says, “This is not a step”.

Have a great Fourth of July. My fireworks will be underground.

Posted in Climate | Leave a comment

Star Trek and the Internet

This may seem a large span to bridge, but there was a unique concept of disassembly and reassembly In Star Trek that the internet converged to, if it didn’t copy it out right…

“Beam me up” presumed not only that matter and energy were equivalent, but that information, the organization of matter and energy, could be disassembled and reassembled as well.

The internet has proved the point for information. Every email, text, or twitter we send is immediately decomposed and spread across the entire grid; to be reassembled only where it is desired. Casting seeds to the wind.

Matter and energy are not cooperating just yet. Information has no mass, and therefore infinite energy. Information is high energy of position…high entropy.

Posted in Climate | Leave a comment

Construction and War

I was a union carpenter in the late seventies. I began as an apprentice, but quickly moved to journeyman in a few months. The master carpenters of that era were all surviving servicemen from WWII. They had an entirely different perspective on life, risk, and construction.

More like this. The construction veterans of the seventies approached construction as if it were war. All in, get it done, don’t screw it up.

The world seems pregnant with war. I worry that the current generation of construction workers, coddled with bright vests, safety harnesses, and extra water breaks when it gets hot, will not be ready for war.

Construction has changed, war has not.

Posted in Animal Behavior | Leave a comment

Paradise to Ice: Carbon Starved Planet Chapter 2

Chapter one can be found here.

2.

Where Carbon Comes From


Water and element number six in the form of Carbon Dioxide are the two largest gaseous products of volcanic activity. Having floated around the universe for a while, element six was part of the cosmic dust that coalesced into our solar system and planet. Still mysterious internal churnings spew molten rock and these gasses continuously on our planet today. The current annual volcanic production of CO2 is thought to be only about a third of a gigaton, so it is considered insignificant in the annual Carbon cycle. Oxygen is two doors down at number eight in our cosmology and there are two of them in CO2. The atomic numbers are proportional to the weight so total annual volcanic Carbon is a measly tenth of a gigaton. We will be talking about gigatons a lot. It is easy to become cavalier about moving hundreds of them around. A gigaton is the weight (on earth) or mass of a cubic kilometer of water.

Nasa volcano


This is a USGS photo of a volcano in Alaska. If we take the tenth of a gigaton for an average year and extend it back three billion years to when things had settled down enough for the earth to have a crust and some sort of oceans with stromatolites in it, we get three hundred million gigatons of Carbon that should be found in various reservoirs. The totals for the reservoirs in a typical Carbon Cycle imodel are only about sixty thousand gigatons, so you can see we have a lot of missing Carbon. More serious estimates put the total Carbon stored in the earth’s crust at as carbonate and fossil fuels as high as one hundred million gigatons. This is still short by two thirds.

stromatolites

Stromatolites like these in Australia were producing Oxygen from CO2 three billion years ago. The real question seems not to be where did the Carbon come from, but where did the Carbon go?

Some carbonate is subducted back into the crust at ocean trenches. There is reason to believe that volcanic activity may have been higher in the dinosaur era but we really don’t have much to go by before that because the ocean floor has been recycled. It is possible we live in a volcanically active time that does not accurately represent the last three billion years.

We will chalk the missing Carbon up to just another unsolved mystery. It seems more than just coincidence that volcanoes produce the elements essential to life. Carbon and Oxygen alone comprise eighty three percent of human body weight and that lightweight Hydrogen another ten percent. For all this you can thank volcanoes. You can also thank them for the water in the oceans.

Posted in Climate | Leave a comment