The Pause That Refreshes

We hear more and more about the Pause. This pause refers to a hiatus in lower atmospheric warming for a human generation since 1997. This “pause” by its very name implies that warming will resume sometime soon.

Only zealots will claim to know whether warming will resume or not. What we do know is that lower atmospheric temperatures declined from 1945 to 1976. The following quote from Newsweek in 1975:

April 28, 1975  “There are ominous signs that Earth’s weather patterns have begun to change dramatically….The evidence in support of these predictions has now begun to accumulate so massively that meteorologists are hard-pressed to keep up with it….The central fact is that…the earth’s climate seems to be cooling down…If the climate change is as profound as some of the pessimists fear, the resulting famines could be catastrophic.”

It did not turn out that way at all. It was the end of a 60-70 year cycle that we do not understand. Will it still be a “pause” if temperatures decline for another twenty years?

Holocene_Temperature_Variations_Rev

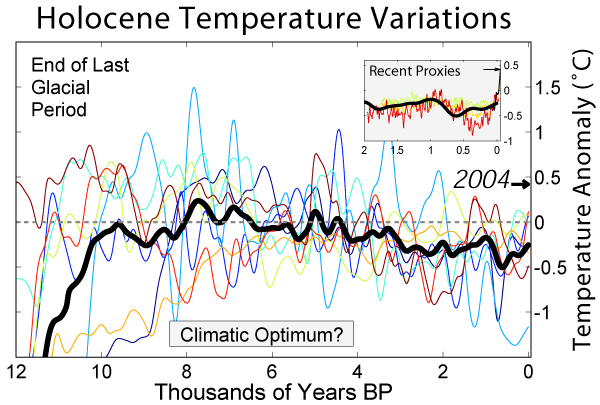
This is the average of a bevy of proxies since the last glaciation. The lunch money stuff  between WWII and the present doesn’t even register here. One can see there have been several “pauses” along the way, and several episodes of warming.

If we are going to match trends, which one do we match? The Newsweek from 1975 which was absolutely correct in its assessment of the trend, or this one from the BBC in 1997, equally correct for the trend at that time:

November 7, 1997, (BBC commentator): “It appears that we have a very good case for suggesting that the El Niños are going to become more frequent, and they’re going to become more intense and in a few years, or a decade or so, we’ll go into a permanent El Nino. So instead of having cool water periods for a year or two, we’ll have El Niño upon El Niño, and that will become the norm. And you’ll have an El Niño, that instead of lasting 18 months, lasts 18 years.”

This one did not turn out so well either, and if you could only know, it would be well to avoid rash predictions on the cusp of phase changes.

What the “pause” certainly tells us is that natural cycles at least equal human changes to the climate.

When it is getting hot, a pause is always refreshing.


Posted in Climate, Global Warming, Paleoclimate, the "Pause" | Tagged , | Leave a comment

Huston, We have a Few More Problems

Humans are not naturally inclined to science. We yearn for certainty, the sort of certainty mathematical equations could provide if only we could be certain of the factors. We cannot.

We don’t really yearn for mathematics, it is just another weird hieroglyphic language but for the allure of certainty. We really yearn for cosmology, for some shaman to tell us that first there was Hydrogen, which begat Helium, and so on until the pantheon is full give or take a few elements generated in accelerators.

Huston, we believed in the asthenosphere. We believed in hotspots and mantle plumes. We believed the ocean basins spread evenly away from the ridges like a giant basaltic recording tape, gently pushing and pulling the toy sailboats of continents about, all moving easily atop asthenia, a magical layer of plastic rock.

Huston, we have used earthquake waves to take pictures that make the things we believed in appear as childish cartoons.

Hawaii no Plume

Huston, here is the hotspot under Hawaii, where being the plume?

Incredulous, we lowered “thumpers” to the ocean floor and using computer models and “SKS” data were finally able to extract this image:

SKS

Huston, what the hell is that? How does it move relative to other hotspots? Where is the signal for asthenia (aside from the neatly drawn white line)? It gets worse.

Mantle

This stuff looks like funky dentistry. The continents have roots deeper than the asthenosphere, the Moho, which is discontinuous and lacking mojo. The ocean basins and their magnetic stripes are cut by lineations we have no explanation for. There are granitic structures in the ocean floor that have no right to be there. Ocean floor sediments have been baked by ocean floor younger than the sediments themselves.

Huston, we are coming home. Home to a world less certain than the one we left.


Posted in Asthenia, Geology, Large Igneous Provinces, Magnetic Reversals, Moho, Oceanography, Plate Tectonics, Seismic Tomography | Tagged , , , | Leave a comment

Spectra, Goddess of Light

We worship in strange and disjointed ways. One seeking to better understand how Spectra’s blessings arrive and leave our planet is confronted with a bewildering array of graphics.

drawing

This one shows incoming light in nanometers.

curve_s

This one shows outgoing in inverse centimeters.

CO2Abs4x

This one shows the saturation of outgoing CO2 bands in microns.

A fine kettle of fish. It reflects poorly the clarity of those paid to understand the Goddess when not a single unit matches anywhere and the inverted wavenumbers read backwards relative to microns and nanometers.

First, we clarify what CO2 saturation looks like in the parallel universe of inverted centimeters.

saturated

According to the Beer-Lambert law fluorescent response to a constant light source decreases approximately logarithmically with increased concentration of gas until saturation is reached and increases in the gas have no more effect. We have plotted Gavin Schmidt’s saturation bands. Boy, if anyone had bothered to do this before, what reason would there ever have been to worry?

Finally, we normalize all the discordant units into the big picture as our offering.

Normalized 1


Posted in Climate, Greenhouse Spectra, Optical Material Properties, Photon, Spectra | Tagged , , , | Leave a comment

Large Igneous Provinces, Temperature, Sea Level, and Extinctions

We had been looking at the stuff one can easily google regarding global temperature and large igneous provinces (LIP’s) and it seemed there might be something, so we dug in. There is an organization, largeigneousprovinces.org, that has excel data in some sort of Arcmap format. We were interested in big events so we set a standard of a million cubic kilometers of production. We took the total volume and spread it over the period of production.

Sometimes you just have to concede that what little we know just doesn’t make much sense. The graph below is basically a study of our ignorance.

LIP etc3


The resulting LIP production is shown in red. The first surprise is that the vaunted Siberian and Deccan events that correspond closely to the PTr and KPg extinctions are not impressive in terms of volume. If these events played a part in the extinctions it was a qualitative and not a quantitative factor. The second surprise is the extreme “twin towers” bracketing the Cretaceous Normal Superchron and the high levels between them.

It would be easy to develop an hypothesis that swings of polarity depend on internal pressures that when relieved by massive extrusions, reduce the dynamo’s tendency to flip.

Another huge surprise is the low sea level during the Triassic. The steric (thermal expansion) rise of the current ocean is thought to be about half a meter per degree warming of the entire column. It was five degrees warmer then so an equivalent volume of the current ocean should have been a few meters higher than today. There were no glaciers storing water on land. Yet sea level was about 25 meters lower than  today, and we live in an ice age. Furthermore, sea level continued to drop as temperatures began to recover in the late Permian and early Triassic and reached a nadir at about the apex of temperature.

Really weird. This coincidence of low sea level and high temperature may speak more profoundly to the severity of the extinction than the Siberian basalt.

The oldest surviving ocean floor is about 250 million years old and it is not until about 150 mya that we get enough floor area to accurately gauge the output volumes of LIP’s. So we really don’t know how much was being produced in the Triassic, but we do know that LIP’s are typically emplaced in isostatic “rises” that displace ocean and that the volume of basalt displaces more ocean, so it could be that the Triassic was a time of low volcanic activity. So why was it so bloody hot?

It is quite clear that temperature has little to do with extinctions, at least when sea level is high. It seems that LIP’s have little to do with temperature. It seems temperature has little to do with sea level.

So all we get is LIP’s raising sea level and temporarily switching the dynamo to DC?

Posted in Climate, Cretaceous normal superchron, Extinctions, Geology, Large Igneous Provinces, Magnetic Reversals, Paleo Sea Level, Paleoclimate | Tagged , , | Leave a comment

Nature and Chaos

We don’t even know what randomness is. In gambling and cryptography computer algorithms are used to create “pseudo” random strings that are difficult to cipher, but ultimately these are “determined” by the algorithm.

To get “true” randomness we resort to physics. Lava lamps were used, but they were simply analog generators like dice in the universe of Newtonian Physics. We derive true randomness by delving into the parallel universe of quantum physics, the end of science, where nothing is reproducible, where to perceive something we irrevocably change it and even create it in the form it is perceived.

Photon, the god of chaos.

It is as if the universe of quantum were encrypted in a fashion contrary to our nature. Fortunately, quantum is an atomic scale nano universe largely irrelevant at planetary scale.

Life has always stood as a glaring exception to the second law of thermodynamics. The elders of such laws smile indulgently and allow that special exceptions can be made in some circumstances, and that in the case of life, pockets of organization will be allowed.

Very kind of them.

Entropy and chaos, Newtonian and quantum. One is tempted to throw in cacophony. These are enemies of life. It is the nature of life to self organize. To claw and grab and secrete. To perceive photons through the “two slits” of our eyes and derive 3D information.

We submit that life is fully deserving its own law of thermodynamics.

Posted in Anthropology, Biology, Chaos, Fourth Law of Thermodynamics, god of chaos, Randomness | Tagged , , , | Leave a comment

California Drought Update Early March

2013-14 SF Seasonal

San Francisco did break the record of 1917 as of January, but just barely. Had the rains begun a day earlier as forecast, the monthly record would have held. Anyway, the drought is definitely not the end of life as we know it and it would be premature to abandon our cliff dwellings and migrate north.

The nearly half a foot of rain in February already guarantees that the 2013-14 season will be wetter than 1850 and 1975, and it is my very strong suspicion that rains thus far in March will push the season past 1897 as well. Not even in the top three!

What is truly remarkable is how closely the season is tracking 1917. I still want to find the time to sort the data for patterns like this. For background on the graph see here and here.

Posted in Climate, San Francisco Rainfall | Tagged , | Leave a comment

Cold is the New Hot

Once it was that everything was getting hotter and hotter and pretty soon we would be frying eggs by just putting the pan outside. This was to have been because a certain trace gas was invested with magical powers far beyond its proportion. This gas was evil, and certain to incite the wrath of the gods.

It has come to pass that it has not got hotter, but rather stayed the same for the time a newborn becomes an adult. The shamans pondered. They dug in the ice and found from the layers that the evil gas followed temperature everywhere temperature went. Ah, it was not pulling it, it was pushing it. Temperature was copying the gas in advance.

In the end the answer was clear. The bewitched gas also causes cold!

Posted in Anthropology, Climate, Climate Change, Cold is the New Hot, Global Warming, Religion, Shamanism | Tagged , | Leave a comment

Rocks, The Origional Hard Data

You simply can’t deny rock. Kick it and it throbs your toe. They lie around us, largely ignored, Farmers curse them and pile them in walls, yet a few dedicated folks with pointed hammers have picked them to yield an incredible window into the past of our planet.

Here we endeavor to place existing surface rocks into proposed paleogeographic contexts as spatial method for evaluation.

G160

This is our world 160 million years ago as those who measure the paleomagnetism of rocks would have it. The positions of the continents and new ocean floor are based on work by Christopher Scotese. The current position of the US and all existing surface Jurassic rocks can be seen to the left. The Wrangell and Stikine terranes can be seen over the current US, supposedly migrating like whales to their current location in the crook of Alaska.

Thirty million years worth of the breakup of Pangea can be seen in the red/orange/yellow ocean floor opening in the Atlantic and Gulf of Mexico basins. The points and arrows indicate the sinuous wander path of Colorado since 250 mya for the coordinates of four corners and NE Colorado in 10 my increments. It is important to remember that the magnetic alignment of rocks during crystallization, adjusted for rocking of the boat, yields direct information only for latitude. Longitude can be constrained by certain statistical techniques and by the magnetization of existing ocean floor. The oldest shards of ocean floor can be found in the Mediterranean about 250 mya.

G160 WUS

Here we zoomed in to detail of happening rocks 160 mya (spreadsheet available on request). The green rocks are marine sedimentary, yellow freshwater sedimentary, purple metamorphic, orange mafic volcanic, red general volcanic, and extra red felsic volcanic. Plutonic are magenta and chartreuse. Anyway, the rowdy colors are the hot stuff.

We can see that generally the green marine rocks are where they ought to be in the syncline seaway. It is difficult to justify the craton extending beyond the paleo margin of California, particularly as there are marine rocks in the San Gabriels and the Western Sierra province.

The position of the Stikine terrane makes little sense. Perhaps the Klamaths were further south a bit, but too much and they would interfere with Sierra plutonism. The Colorado vectors and the direction of the Pacific Ocean floor discussed here would have seemingly docked the terrane in the Columbia embayment.

It seems clear that existing surface rocks placed in their paleogeographic contexts argue for revision of current notions. They must be accounted for. If they moved, where? When? By what means?

Hard data.

Posted in Continental Wander Path, Geography, Geological Evolution of the Western United States, Geology, hard data, Paleogeography, Plate Tectonics, Seafloor Isochrons | Tagged , , , | Leave a comment

A Graphic Study of the Greenhouse Effect

The greenhouse effect is poorly named. Nothing about it even vaguely resembles the protective shield of a greenhouse. The effect is about the florescence of certain gasses in a discontinuous fashion according to their individual spectral properties. When they shine, they warm the atmosphere.

It is very hard to graphically represent the greenhouse effect because the incoming and outgoing spectra cover large ranges on different axes. The result in the center top image below has a “golden Mean” aspect ratio, but we won’t go there…

The total energy of these radically different spectra is equal, even though incoming solar radiation has enormous power over a narrow range, and earth spectra has relatively low power over a very broad range.

Greenhouse

Approximations of the spectra in relation to the blackbody curves are displayed red with the greenhouse absorption bands green for CO2, blue for H2O, and magenta for O3. Carbon dioxide enjoys a position near top dead center of the power spectrum for outgoing radiation that no greenhouse gas occupies on the incoming side. H2O overlaps top dead center on the output side as well.

The entire earth output spectrum is saturated. This does not mean that adding more greenhouse gas has no effect. It means that adding more light has no effect. This may be a reason fluctuations of solar intensity seemingly make little difference.

The reason the output side is saturated and some light gets through at all wavelengths is the photon food fight. This melee is a virtual plasma of energy exchange between the surface and the atmosphere where more light is cycling than the gasses can absorb.

Not so on the input side.

Black Hole

Here there are unsaturated “black hole” H2O bands where a meter pointed at the sky registers no light. Thirty percent of incoming light is reflected or refracted and may pass through these bands multiple times.

We tend to always think of the greenhouse effect as “bottom up”, but really half of it is “top down”. The unsaturated H2O bands on the incoming side will be sensitive to changes in insolation. The outgoing bands busy with the photon food fight will not.

Posted in Greenhouse Effect, Greenhouse Spectra, Photon Food Fight, Unsaturated "black hole" H2O bands | Tagged , | 6 Comments

Around the World in Eighty Million Years

We have been doing a puzzle like you might have been given in first grade where there is some large animal with lines missing and your job is to connect the dots and fill it in.

The joy is still there, but as you will see the technique hasn’t improved much.

Around the world in 80

This is an image from the kml file for 60 mya based on work by Christopher Scotese. We decided to play a little game of “fill in the isochron”. The brightly colored areas are existing ocean floor with existing isochrons wee can drill and measure. The grey colors are continents as of 60 mya. The dark blue is windows into the Google Earth imagery where ocean floor has been lost. The white lines are our efforts of pure speculation, but we tried to match features suggested by remnants.

It seems to us that this represents the simplest possible reconstruction, and since it can reasonably be construed to fill the entire ocean basin, we feel no need for anything more complex. We were very surprised to follow existing ocean floor for more than half of the 80 mya isochron.

superchron

We have drawn our speculative white lines to bracket between the 120 and 80 mya existing isochrons because this was the long Cretaceous normal “superchron” when the planet felt no need to switch polarity for the longest time we are aware of. The spacing shown is nice and even because it is entirely interpolated and every bit as speculative as what we have done. We did not continue this interpolation and speculated only for the entire superchron.

West Pac

This is detail of our suggestions for the western Pacific. The continents are in their 60 mya positions. We stopped at the 80 mya isochron because other stuff seems to be going on, but with two more isochrons we could easily fill the basin.

Kula

Some workers have posited a ridge between the red 60 mya floor and the red patch Scotese is suggesting in Washington and Oregon. The purpose of this ridge was to define and push a hypothetical plate named Kula as a vehicle for carrying various exotic terranes to their proper docking points. While there is room for such a plate and it cannot be excluded, any direct evidence for it has been subducted.

We feel very comfortable that the tectonic history of the Pacific Ocean floor can be adequately explained by concentric growth from a single point and its early expression as a triangle. We have suggested that the point could have been an impact. It could also possibly be thought of as an extremely large igneous province with an attitude.

Either way, existing seafloor records a ring half way around the world eighty million years ago. We have supplied the rest.

Posted in Cretaceous normal superchron, Geography, Geology, Magnetic Reversals, Pacific Triangle, Paleogeography, Plate Tectonics, Seafloor Isochrons | Tagged , , | Leave a comment