Wild Rogue

IMG_0517

It had been fourteen years since last running the wilderness section of the Rogue river with my two younger kids then chest high. The first June of the new millennium saw very high flows and few other boaters. The river was roaring and a bit intimidating. Bearing my wife’s stern admonitions we scouted most of the rapids. I remember waiting on the trail that follows the river for a couple of hours pondering the chaotic hydraulics on one rapid and being very relieved and fortunate to see a single raft, probably a local who knew the river well, bounce uneventfully down the middle.

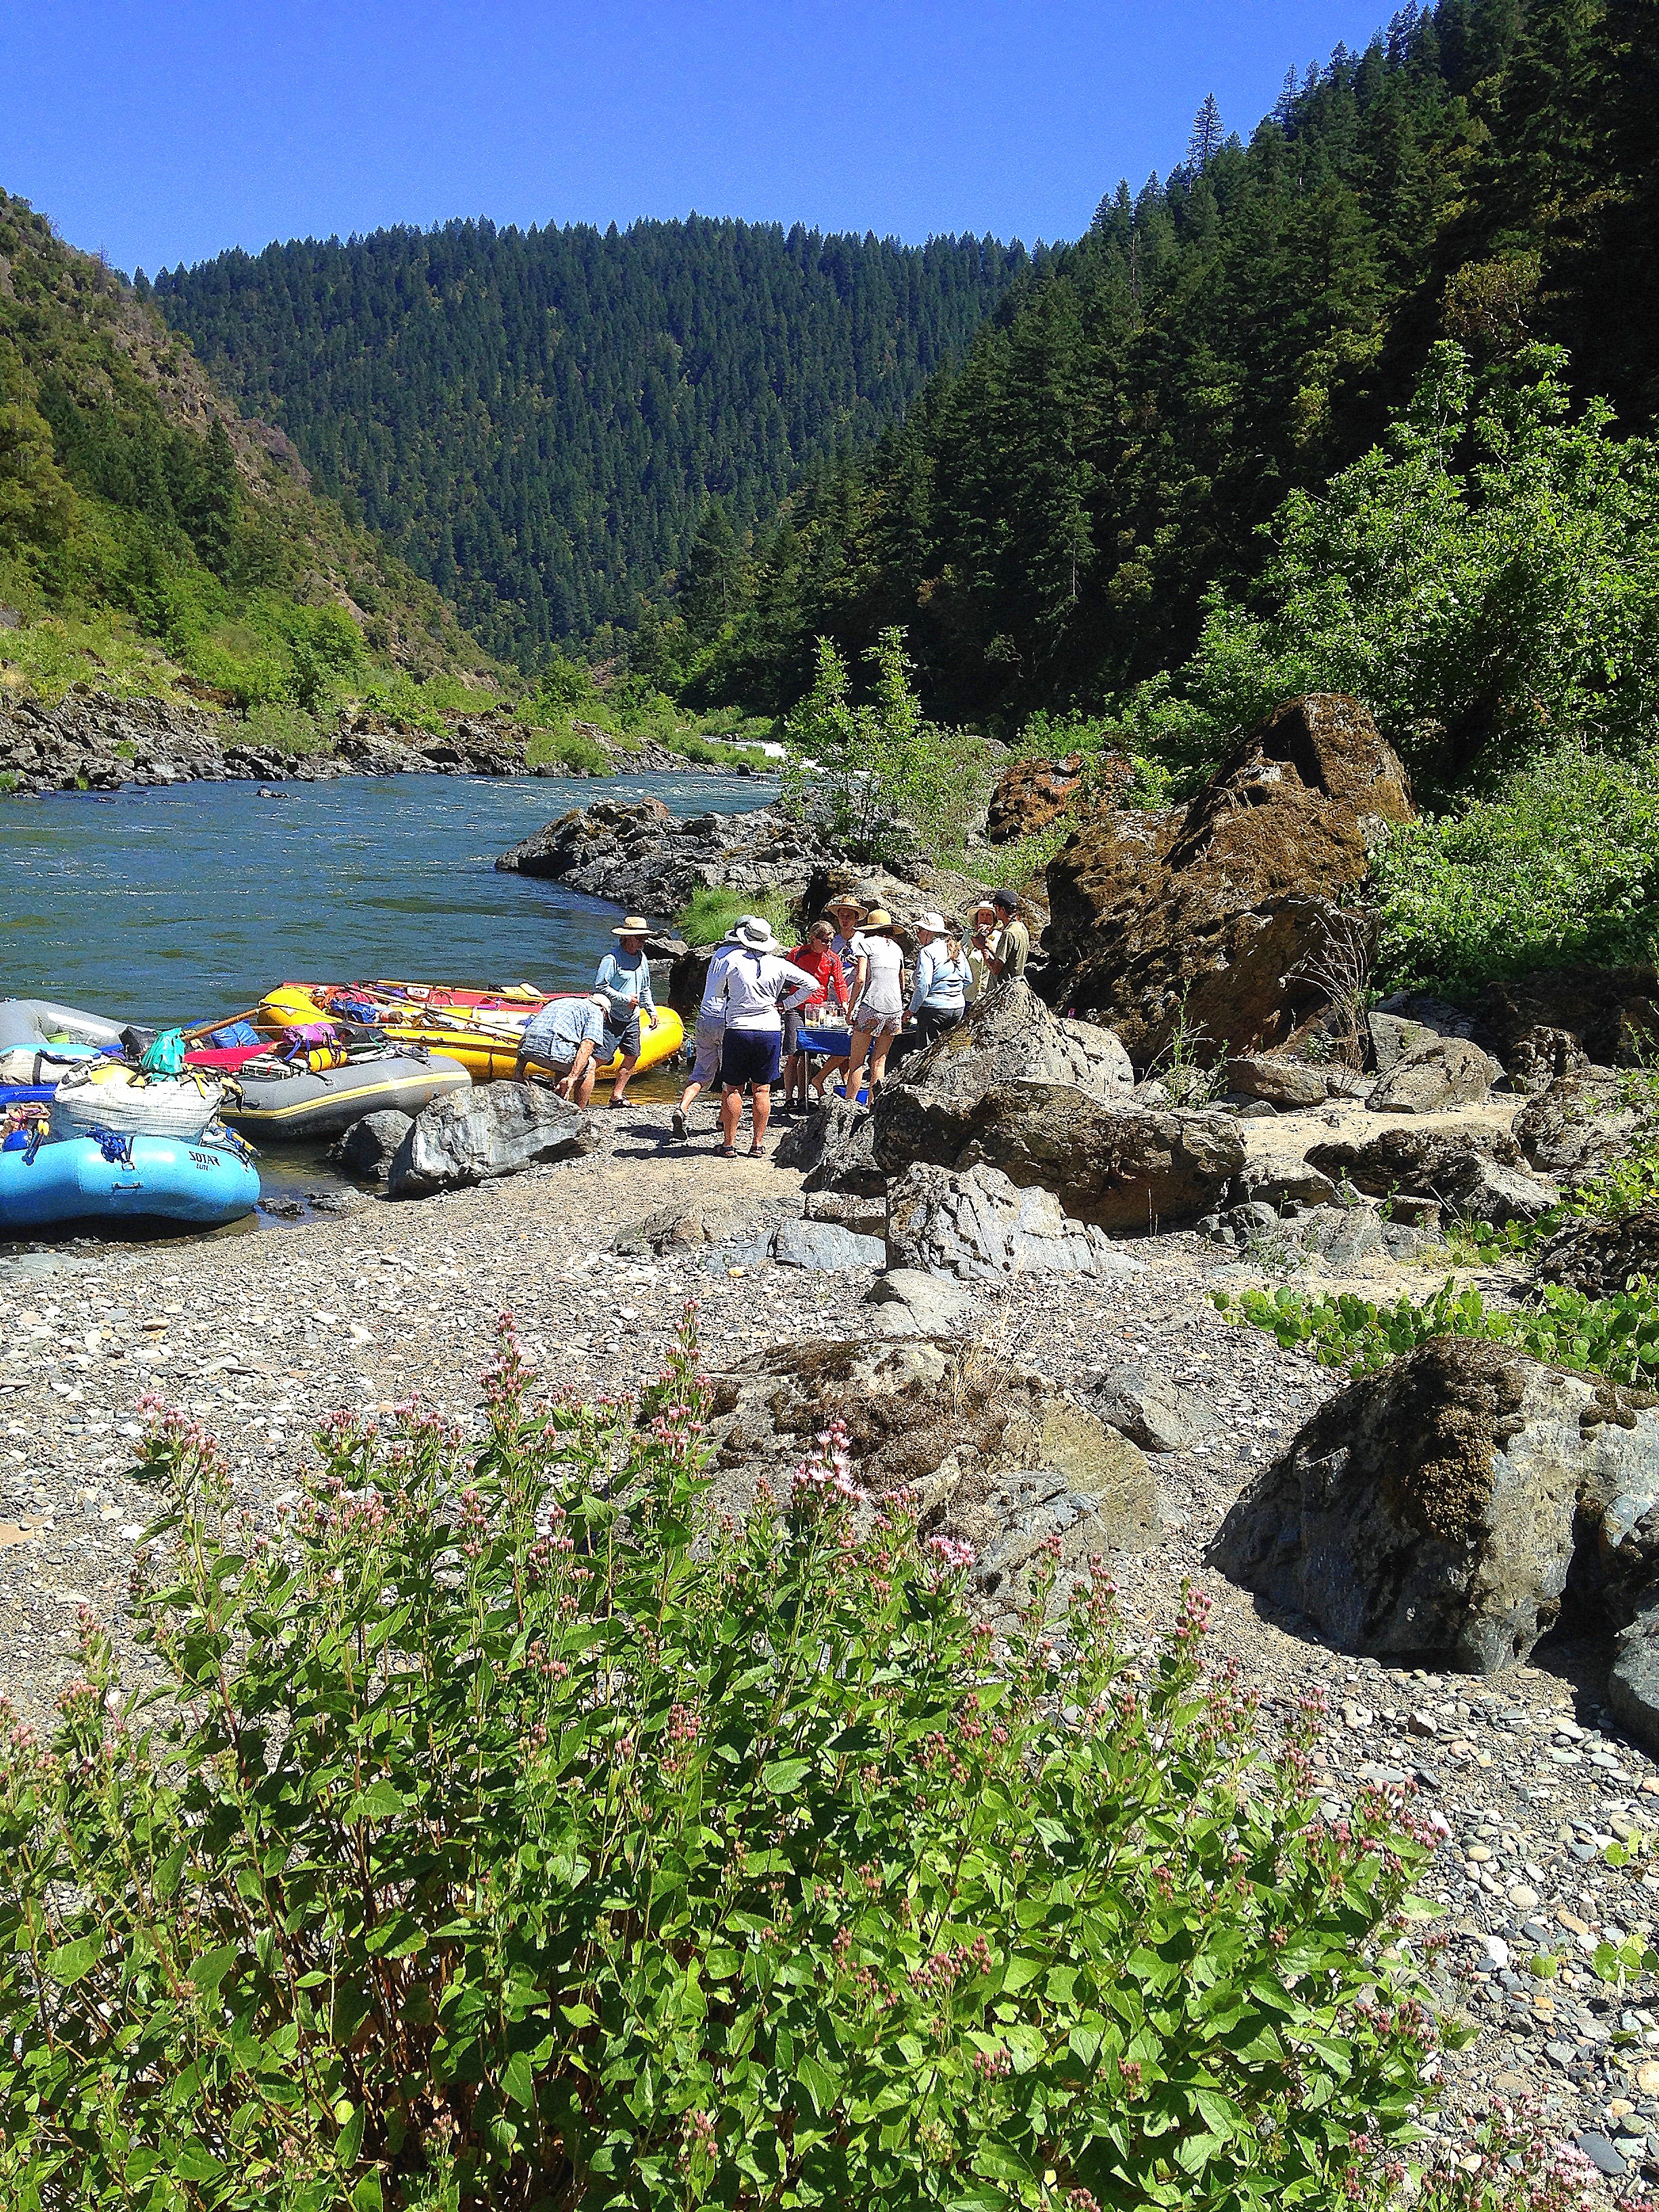
We did the same and had a wonderful trip that left nothing but fond memories. I had not even got my raft in the water for last season so I  jumped at the opportunity to join a trip down the Rogue this year. Rather than a single boat with two kids, this trip had five working boats rowed by extremely competent and experienced boatmen. Rather than high flows, we had sufficient but moderate water to enjoy.

The so called fish ladder is a channel blasted for a route around Rainey Falls. I seriously doubt the fish were in need of such a ladder and suspect it was more the love of kaboom and the need for a human ladder. In June 2000 it was definitely the only game in town as a result of the high flow and this year the water was too low for the other alternatives to running the actual falls and we all wound up taking the fish ladder this time as well.

Oar boats do not do well in the fish ladder and this time we got spun around two times but when you get to the bottom with no broken oars or bones you’ve had a decent run.

At moderate flows the wild Rogue is just a read and run river with fun bouncy rapids. Upstream winds can be a problem on the flats and we were in a onshore pattern with one rainy night, but this is the Pacific Northwest after all.

IMG_0493

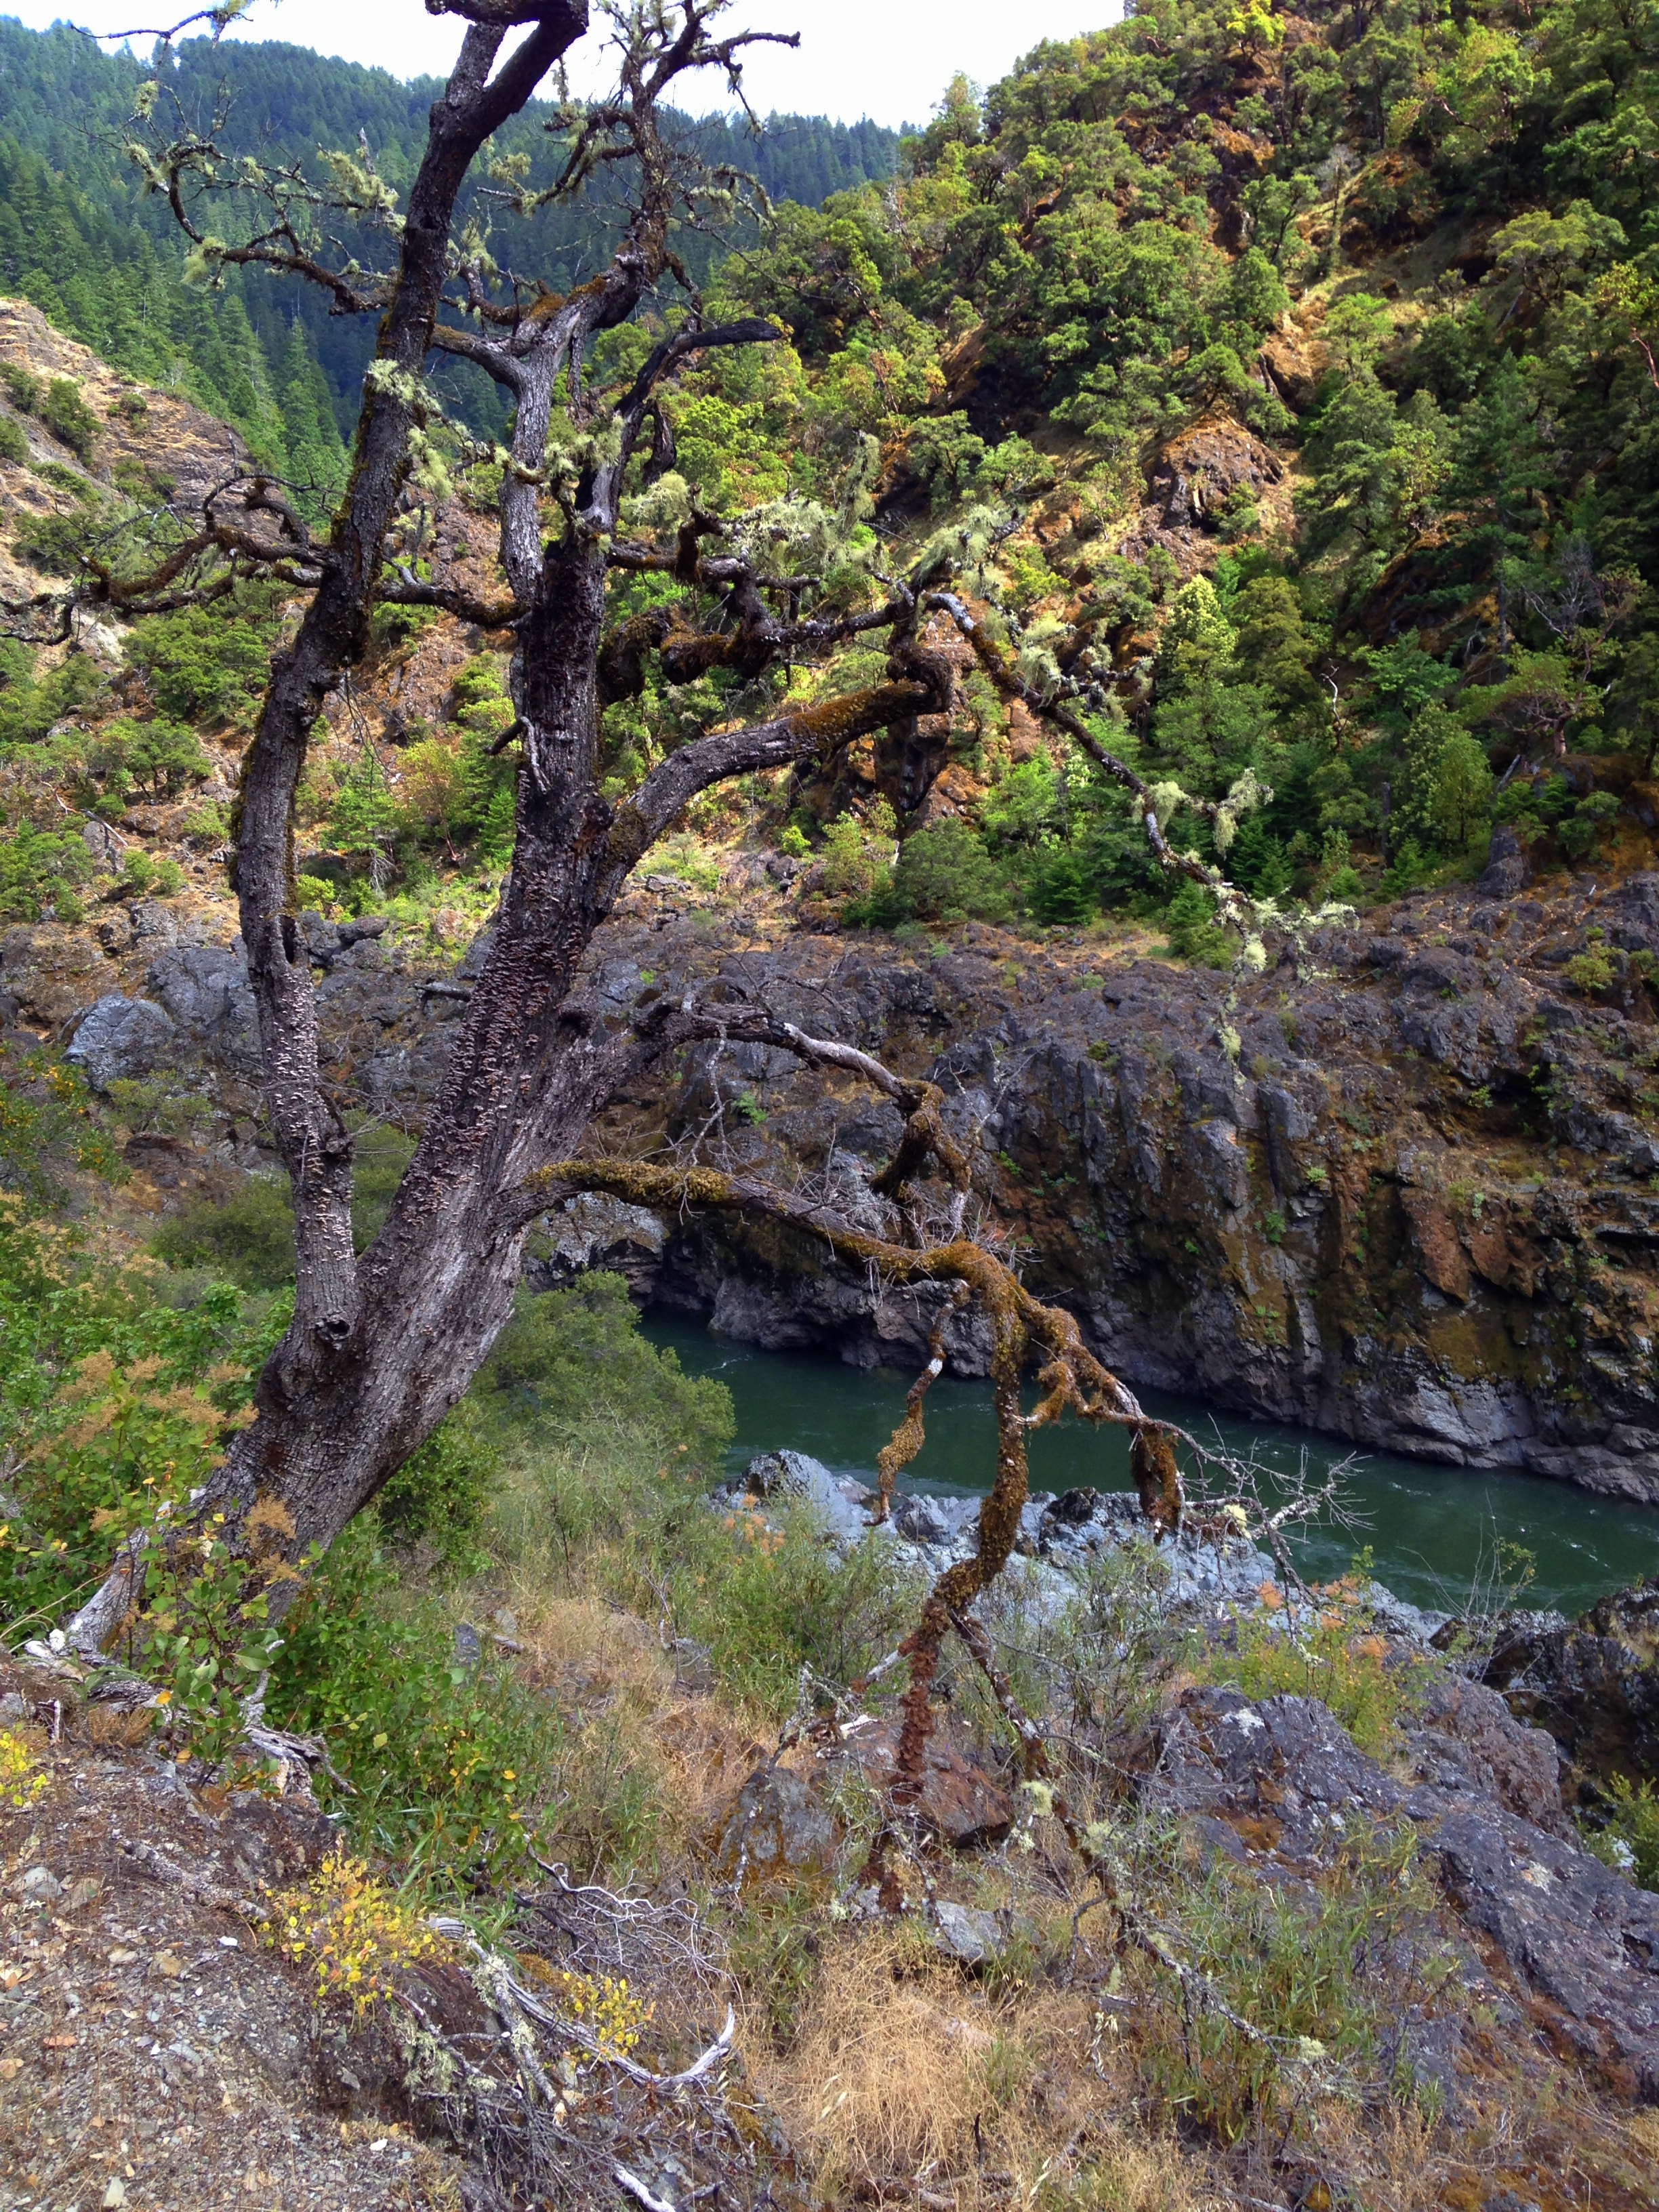
Lush forests of Douglass fir, oak and madrone line canyon walls of alternating sediments and metamorphosed ocean floor that get progressively younger as you proceed down the river. The bigger rapids take place at the sutures between rock units with harder metamorphic and volcanic rock forming ledges where softer rock downstream was chewed away. For reasons we really do not understand a succession of volcanic island arcs and their eroded sediment basins piled up one after the other in the area of the Klamath and Siskiyou mountains of northern California and southern Oregon beginning two billion years ago when the single celled creatures living then were first evolving nuclei and the continents were apparently swept into a pile down at the south pole.

IMG_0508

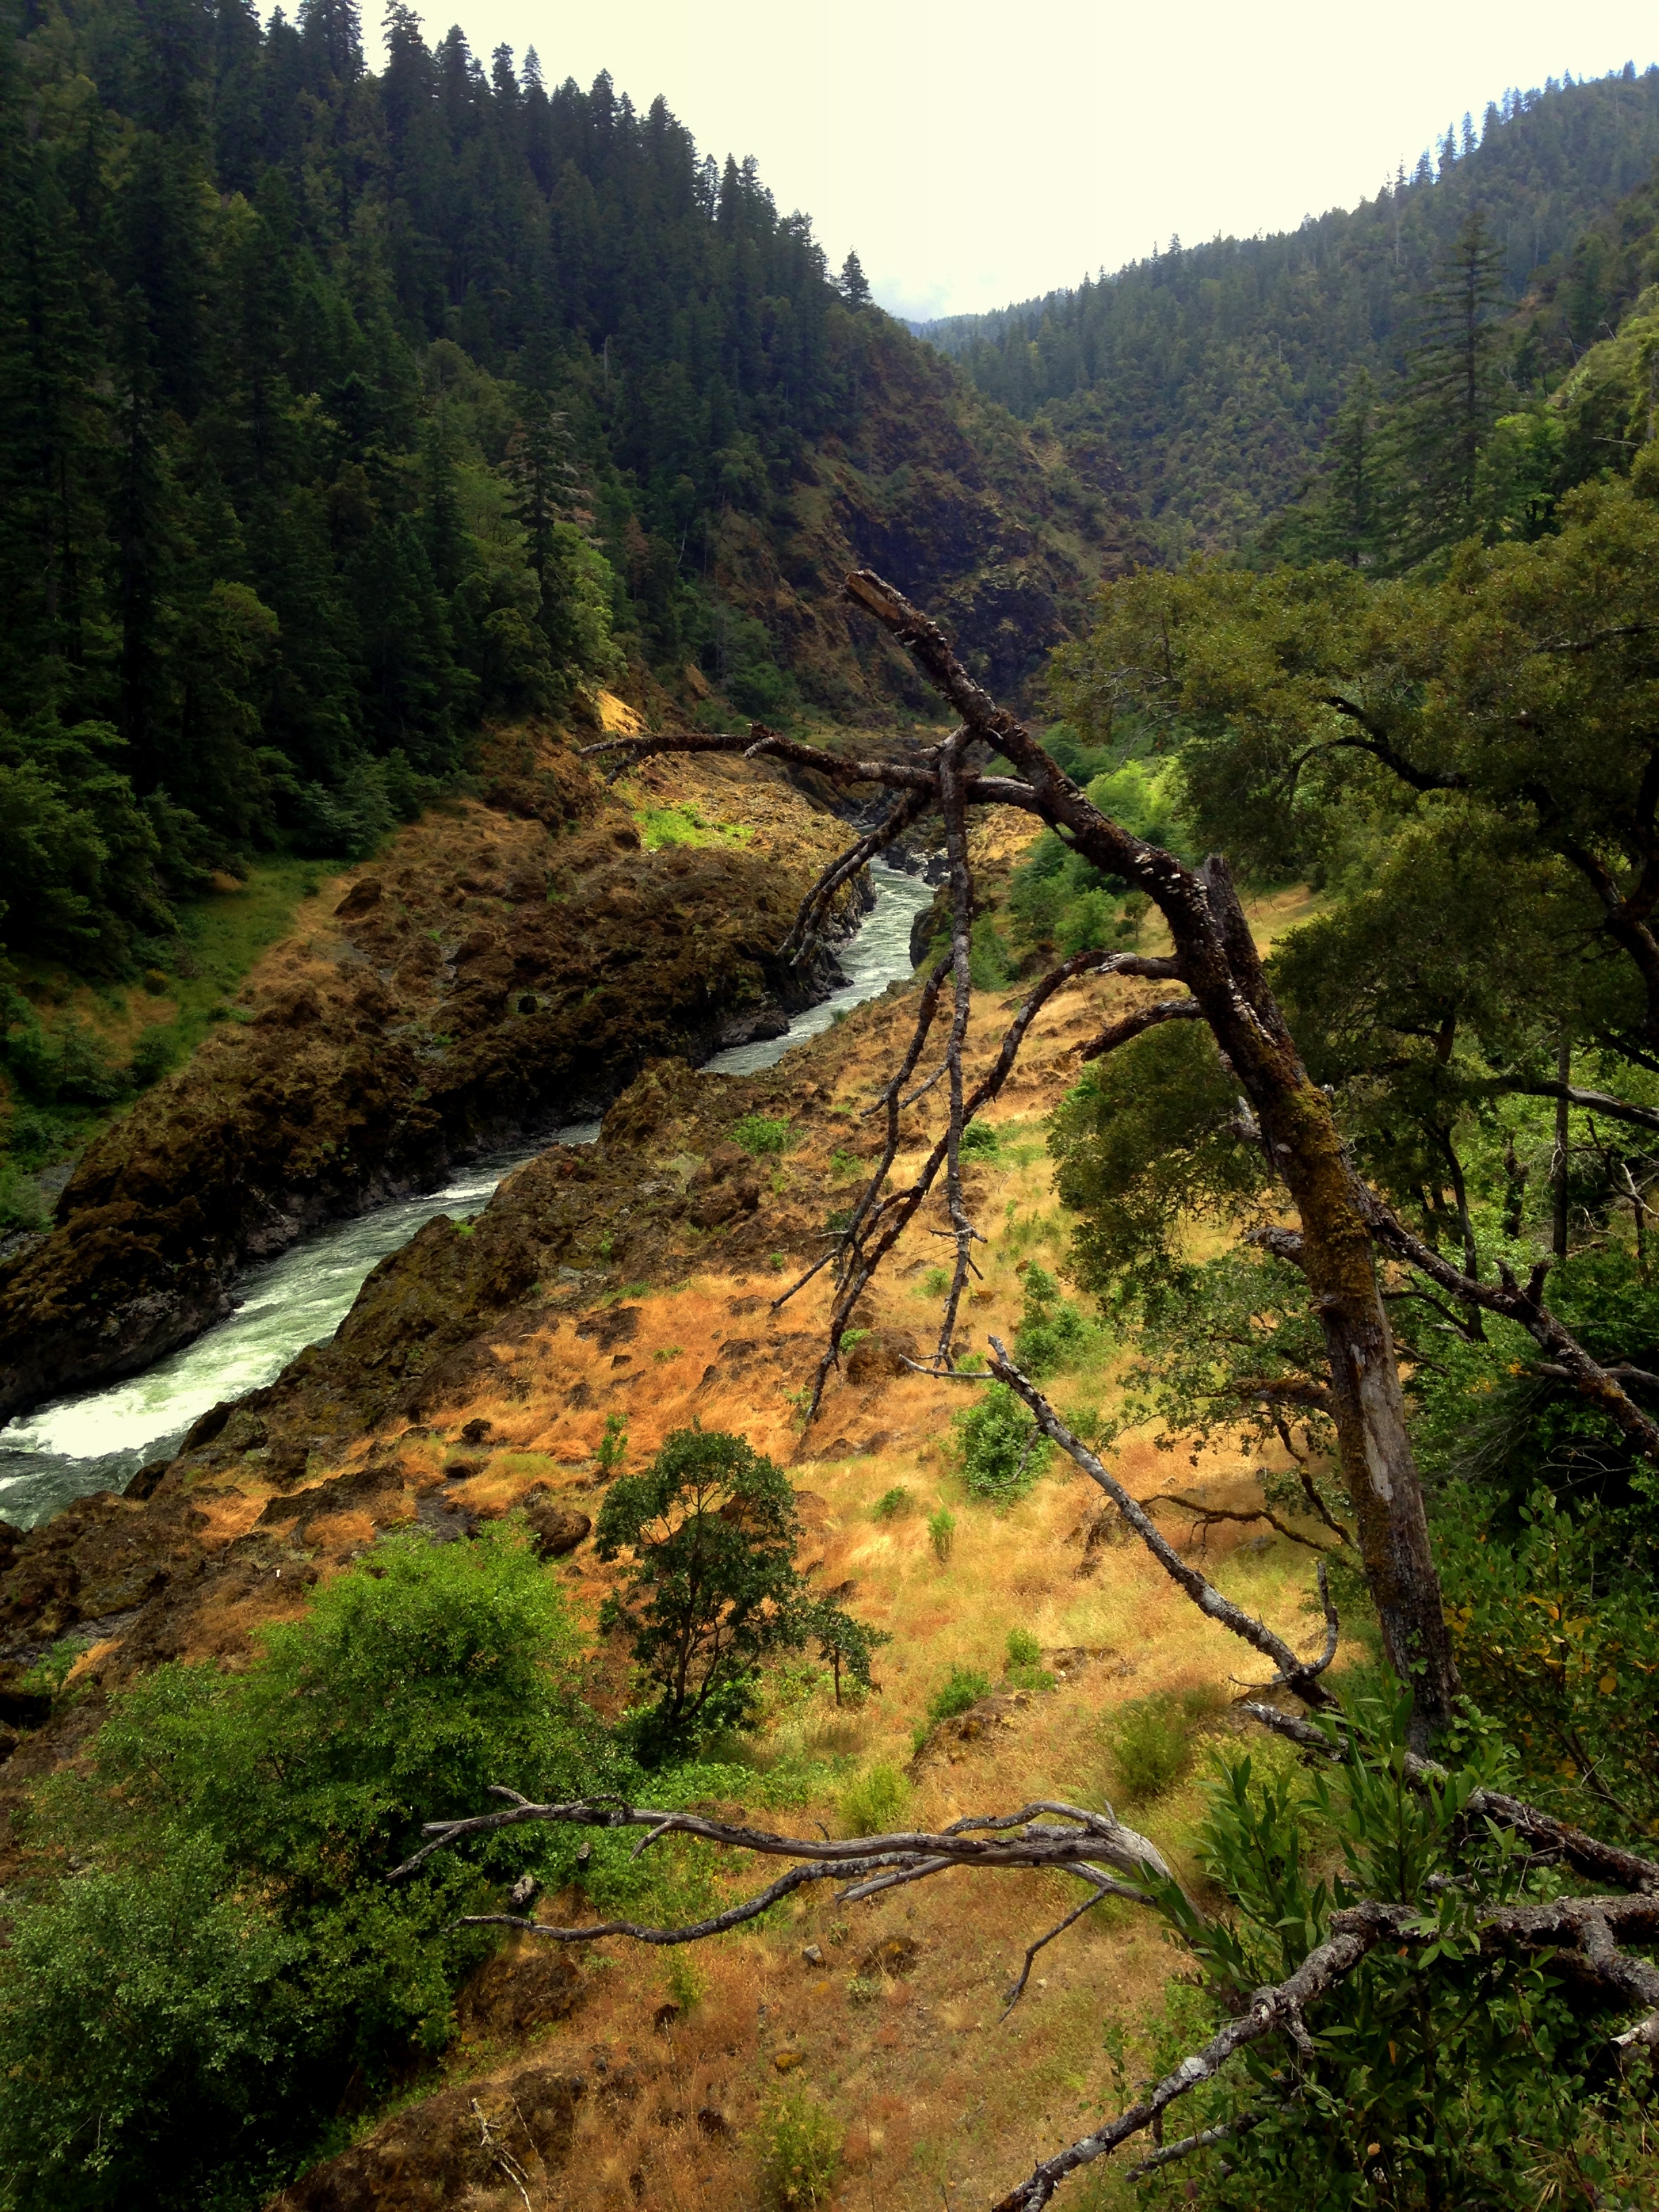
In Mule Creek Canyon the river cuts between two rock types but the canyon itself seems to be cut into a metamorphic basement underlying the entire complex. Mule Creek Canyon culminates in Blossom Bar rapid, the most technical on the river. At high water in 2000 we were held for a bit in a giant hole where water crashed over the top of the big boulders and pounded down on a kayak strapped across the back of the raft. This year we had difficulty crossing from the scouting eddy back into the main channel. When we finally succeeded on the third try the rapid was pretty easy, but it is very important to get out of the left side current where you must enter and cross to the center channel.

As we approached the take out, my friend Laura who is a veteran of 17 days in the Grand Canyon with me a few years ago asked me what it was about the rivers that keeps me coming back for more. It was a very good question since many senior rafters are beginning to question whether they have the strength for the hard work and the fire in their bellies to take on difficult rapids.

It’s the water. The wonderful ways it moves around the rocks and the awesome power as it falls down rapids. Our hunting and gathering forebears migrated up river canyons, camping as we do, and moving on. Some of us feel that pull and the need to follow the irresistible force of the water, to regain some sense of how to move with it like the fish we once were, and to make it a metaphor for the river we all must follow.


Posted in Geology, Metaphor, River, Rocks, Wilderness | Tagged , | Leave a comment

What Climate Sensitivity Should We Expect?

The great failing of climate science has been the inability to constrain the range of climate sensitivity to human CO2. The possible range remains from slightly negative to +5 degrees for a “doubling”. The concept emerged when the atmosphere was 350 ppm and doubling would be 700 ppm.

We are 50 ppm into the program with little warming to show for it. It is time to look for new approaches. We suggest taking a step back and evaluating what we do know and how that might help us constrain sensitivity.

Half tongue in cheek we have offered a “Dud PDO” index of sensitivity. This is not a great index because we know little about the PDO except that the most recent warming phase was a decade too short for the pattern and it hasn’t warmed since. Maybe the 1997 Niño  shot the wad for the cycle and temperatures have been languishing before a coming fall?During the last cool phase temperatures did fall fitfully for three decades.

We know that human Carbon is only about 5% of the annual Carbon cycle on earth. Elemental Carbon is not a big warming factor, but when you look at the Carbon cycle, Carbon moves through almost entirely as CO2, the accused. One can reasonably argue that our portion of the annual cycle is the outside limit of sensitivity. About half of our emissions appear to be absorbed currently (the red numbers) reducing sensitivity further to around 2.5 %.

Photo Credit: NASA

Photo Credit: NASA


All of the Carbon dioxide currently in the atmosphere represents only about 2% of the “greenhouse gasses” by weight. Humans stand accused of a bit more than 1/4 of the accumulation. However, the gasses do not resonate by weight, they do it by molecule and CO2 is twice as heavy as water, the primary greenhouse agent. For any given weight there will be twice as many resonating molecules of water as CO2. This line of reasoning sets human culpability at about .25% of the greenhouse effect.

Would that it were that simple. A significant part of the greenhouse effect is from the “top down” from incoming solar radiation and CO2 is a marginal player in these spectra.

drawing

This effect potentially divides the .25% in half again.

In the outgoing spectra CO2 occupies a prominent position.

saturated wings

But the bands in the middle of the four vertical lines are saturated by Beer’s law. The narrow columns on either side remain and may be amplified by “pressure broadening“. Pending Robert Brown’ s conclusions on the quantum quantities of the broadening effect, we offer an “energy of the photons” gauge for the importance of saturation. This energy is given by the speed of light divided by the wavelength times Planck’s constant. By tabulating the energies for each wavelength in the CO2 absorption spectrum and subtracting the portion that is saturated, we derive a 63% reduction in energy as a result of saturation.

If we keep dividing our culpability in half like this there won’t be much sensitivity left.

So how much climate sensitivity should we expect? What does it mean that we contribute 5% to a global annual cycle that has resulted in the accumulation of 120 additional ppm of a gas that in aggregate represents 1% of the resonating molecules in the atmosphere? What does it imply that whatever effect our contribution has made is heavily weighted to the outgoing spectrum which is maybe half of the greenhouse effect and perhaps half of that spectrum is saturated?

It means that unless there are feedback or emergent effects that have been conspicuously absent for the last 17 years, we have little reason to expect high climate sensitivity to a “doubling” of CO2. If we are responsible for .0625% of the current greenhouse effect and the greenhouse effect explains all of the warming since 1850 (.8 degrees), we are responsible for .05 degrees so far. Five hundredths of a degree divided by 120 ppm yields a human climate sensitivity of .0004 degrees/ppm.

Not much.


Posted in Climate, climate sensitivity, Dud PDO, Energy of Photons | Tagged | Leave a comment

The Homo erectus and the Climate Scientist.

Habilis probably had fire, but Homo erectus definitely had fire and he would have been around at the last glacial maximum to discuss with a climate scientist the dangers of burning a lot of campfires.

homo-erectus_459008-681x1024[1]

He does not look impressed.

mann-michael-e1[1]

Unconvincing.

The discussion got to the point where the climate scientist declared that if MR. erectus did not quit burning all those campfires the planet would be five or six degrees warmer in 2014.

Mr. erectus replies, “So what?” “It’s too damn cold.” It is a glacial maximum after all.

“Well”, replies the climate scientist, “the sea level will rise.”

“More fish.”

At this point the climate scientist launches into a diatribe about responsibility and saving the planet from eminent doom. This prompts the look from Mr. erectus in the photo op above.

His fingers curl around his club. “Go back to 2014”, he says, “Soon.”

Posted in Climate | Tagged , | Leave a comment

Pressure Broadening

In a recent blog post Dr. Roy Spencer took the skeptical community to task for a list of arguments he considers to lack merit. One of these was the argument that the CO2 absorption bands are saturated. He stated that the saturation was obviated by “pressure broadening” and listed a reference he felt would explain this.

It did not.

Pressure broadening was defined before the 1940’s and much work was done on it in the 1950’s and 60’s. The math is a Lorenzian hairball, but it basically describes interference between colliding molecules on the width of spectral lines of absorption and emission. Typical values for earth conditions are one to ten percent, and the effect pertains not only to “self” broadening by an individual gas, but to all the various gasses and molecules in the atmosphere according to their individual properties.

As such, pressure broadening is just an aspect of the interference that causes saturation in the first place and is not a good way to describe what remains of the CO2 spectrum after saturation.

Here is Gavin Schmidt’s analysis of saturation:

CO2Abs4x

Nobody with any sort of clue believes that the entire CO2 spectrum is saturated, but the absorption and emission bands are a finite phase space according to the properties of the gas. We can therefore think of saturation according to the following analogy:

Suppose you had one painter painting a room and you were in a hurry so you keep adding painters. At some point adding more painters does not increase the painting speed because they just get in each other’s way. This is Saturation. If you put way too many painters inside they might bulge the walls out a bit. This is pressure broadening.

Let’s just say the room is the 15 micron absorption band. What we are really painting is a strip motel with  rooms on either side of room 15. Our ethereal painters are painting all the rooms. Only rooms 14-17 are saturated. Adding more painters to the project will still speed up the painting of rooms 13 and 18, but we can only add painters evenly to all the rooms. The incremental efficiency of adding painters is dramatically reduced by the saturation of rooms 14-17.

Our motel is actually on a hill. Room 15 is at the apex and rooms 13 and 14 and 16-18 fall off opposite sides. Room 15 yields the highest rent. Consider the following:

saturated wings

The vertical lines at wavenumbers 570 and 600 are room 13. The lines at 730 and 770 are room 18. Rooms 14 to 17 between are saturated. That’s the entire motel.

There are a couple of ways we can evaluate the efficiency of our painters. One way is the energy of the photons. This energy is given by Planks’ constant multiplied by the speed of light divided by the wavelength. I have totaled these energies and room 13 gets 1.18E-24, rooms 14-17 get 3.78 and room 18 gets 1.04, all E-24. The total is exactly 6. By this measure 63 percent of the efforts of additional painters will be lost as a result of saturation.

Another approach is to multiply the flux or intensity by the wavelength to derive the watts/m2. One could subtract the observed value from the blackbody value but this is confused by overlapping influences of water and N2O.

The human influence on climate is arguably the most important issue of our age. Our models aren’t working. The models have included an approximately logarithmic diminution of effect for incremental CO2, but if 63 percent of  the effect of CO2 is already lost due to saturation, this could be an important reason for their failings.

Posted in Climate, climate sensitivity, Optical Material Properties, Photon, Pressure Broadening, Spectra | Tagged , , | 2 Comments

The Dud PDO Index of Climate Sensitivity

Climate sensitivity is the response of the climate system to a given increment of CO2. It is often expressed as the response to a “doubling” of this gas from a pre industrial level. Estimates of climate sensitivity are all over the map. Computer models have seriously overestimated this sensitivity as evidenced by their poor performance over the last 17 years. On the other end of the spectrum many workers feel sensitivity may be insignificant to slightly negative.

We offer here a new gauge for sensitivity based on the following analysis:

dT

It is recognized that a certain oscillation first noticed in fishery production called the PDO for Pacific Decadal Oscillation exerts an influence on global temperature. This is really a terrible name because the period of the cycle is something like 60 years. We really have no idea what is causing this and sophisticated statistical analysis cannot pin it down, but if you look at the graphic above you can see that from part of a cycle from 1900 to 1913 and from a full cycle from 1945 to 1976 the red line of global temperature anomaly declined sharply.

The next shift was not due until about 2006, but we had an exceptionally strong El Nino in 1997 that either burned off the remaining warming prematurely or tipped the scale early, or both. Instead of rising or falling global temperature anomaly has been flat for 17 years.

We propose that the difference between the temperature drop in the 17 year period between 1945 and 1962 of .07 degrees C and the lack of any drop in the last 17 years (zero), divided by the increase in atmospheric CO2 from the bottom of the last cycle (1976) to the present of 66 ppm CO2 yields a crude index of climate sensitivity.

If we thought this was a really great index we would have found a more auspicious name, but when the current range of estimates is from negative to Armageddon, we feel that any flake of a toehold is helpful.

The sensitivity given by this index is .001 degrees C/ppm CO2. This is in the lower part of the range and would require an increase of 1000 ppm to get a degree of human temperature change.

Posted in Climate, Climate Change, climate sensitivity, Dud PDO, Global Warming, PDO | Tagged | 1 Comment

On Being a Sheepherder and an Ignoramus

Most of us these days have never herded sheep. It is an ancient human occupation that afforded lots of time for contemplation and gazing at the stars. The reverie was punctuated by emergencies and predators and the mystique of living outside and exposed probably wore off quickly.

Shepherds sleeping bag

We have all been ignoramuses, either studiously or by neglect. The neglect part is easy to understand. The universe of molecular biology is expanding outward at the speed of light these days, and seems to be accelerating. The time required to keep abreast is more than most shepherds can afford.

Here we will explore studious ignorance and the importance of shepherding new ideas.

We are so bound to daily life that we don’t notice that many human behaviors are as mysterious and unbelievable as the foliage of a peacock and other displays in nature. One of these human behaviors is the vestiture of authority in the medieval tradition of academia.

Peacock_With_Fanned_Tail_600[1]

deluxedoctoralgowns[1]

The idea here is validate a certain prescribed course of study and original work within that scope. It is also a rite of acceptance into a clan of wise men vested with authority that distinguishes them from shepherds.

A complex society requires a literate class with the moral authority foster the reigning paradigm and to  keep records. Confucius developed a system of examinations that has been the basis of Asian scholarship for two and a half millennia. Charlemagne imported Irish priests.

Yet there is an inherent conflict between beaurocratic responsibility and nurturing new ideas. This is the shepherd’s role. To live on the exposed and dangerous edge of understanding where new ideas grow. It is better to be a studiously ignorant shepherd, cognizant of what we believe we know, but willing to ignore it.

Posted in Metaphor, Sheepherders and ignoramuses, Wilderness | Tagged | Leave a comment

California Drought Update 4-14

For some reason the validated CDC data for March in San Francisco have been excruciatingly slow, and judging from local data will be revised down slightly. This is peculiar because it was raining hard as March came to a close and the original data indication was from a few hours short of the end of the month. Anyway, it has rained in April and there is no way this years drought will be in the top ten for the Downtown San Francisco dataset, at 164 years the longest in the western U.S.

SF Cumulative 4-14

The data is structured July to June so April 2014 falls in the 2013/2014 season shown here as “2013”. Spooky how closely this year is tracking 1917. The four driest years are shown along with 2011 which was the first year of our so called “record drought”.

We checked the data for any indication that in dry years more rain was pushed into May and June. Nope. Although 1897-98 with only 9.38 total got 1.63 in May and June, the average for the ten driest years is only half the total average for May and June.

Drought American West Cook et al 2007

There is quite a bit of research on past droughts in California and the western U.S. This is from Cook et al 2007 using the Palmer Drought Severity Index. It is interesting as a big picture because it shows a persistent pattern of drought during the Medieval Warm Period and pretty damp until the present when the climate generally seems to be recovering from the Little Ice Age. Within the MWP notice the rapid transition from drought to damp from 1034 to 1100 and return to extreme drought by 1150. These human life scale changes should be bourn in mind. How crazy would “climate change” have seemed to the Anasazi. What sins would they have repented as they abandoned Chaco Canyon in 1130? The western U.S. is a big place and averages mask a lot of regional variation. Drought 34 56 These two years are considered iconic for the two most severe twentieth century western U.S. droughts. Notice the very different conditions for California and the Pacific Northwest between the two regimes.

Drought 951 1380

Zooming in to California we find more complexity from the sediments from our drying fluvial lakes.

Benson et al 2002

Benson 2002 cored Pyramid, Mono, and Owens lakes in the style of the Deep Sea Drilling Project and analyzed Carbon and Oxygen isotopes and other properties of the layers. I hate the units but 1.2=12000 years ago, the end of the last glaciation. One can see the Younger Dryas cold setback up to 11500 and tentative recovery in New Mexico but recovery from it seems to have taken longer to register in the Sierra. The dotted lines are suggested correlations. My eyechrometer says the northern Sierra and New Mexico are more often antiphase than not and the southern Sierra has its feet in both worlds. This is another reason to like the San Francisco dataset. We can expect that future rainfall for California will not necessarily be tandem to the rest of the western U.S. and may alternate between regions of the state.


SF Seasonal Totals

To whatever extent these 164 years represent the 12,000 years since the last glaciation, San Francisco, like California, has its fingers in many puddles. As you can see San Francisco is not particularly impressed with the Pacific Decadal Oscillation, an observed pattern that seems to control the frequency of El Niño’s.

The good news is that the data shows that very rarely do dry periods last more than a few years.

Posted in California Drought, Climate | Tagged , | 1 Comment

Everyone Loves Lists, Should We Worry or Not?

Take a big leap back in time. It is 1974, forty years ago. The planet has been cooling for thirty years. There is very real concern about this. The Pentagon is making Ice Age contingency plans. The scientific community is agnostic. There is realization that we are beginning to put a lot of particulates and CO2 in the air. The concept of the human volcano is developed, but the consensus is definitely that we just do not know how this is going to play.

dT

How is the situation different today? The spectral properties of CO2 in a jar were worked out in the 1950’s. They had been well known for two decades in 1974. We have definitely become the volcano. Shucks, we’re a Large Igneous Province. Yet after enduring three decades of cyclical warming, we have experienced a temperature plateau for an historic human generation.

So let’s just make a list, bearing in mind the two perspectives of 1974 and 2014.

What reasons do we have to expect that Carbon dioxide is dangerously warming the planet?

1. It is a gas that resonates in the earth’s outgoing spectral frequencies .

(Yep, no different than 1974)

2. It is a gas whose increased human production correlated with temperature increase from 1976 to 1997.

(Yep, but it stopped a generation ago. Valuable data gained since 1974)

3. It is a gas that occupies top dead center of the outgoing power spectrum.

(Yep, here.)

4. The stratosphere cooled as the surface air warmed.

(Yep, must be accounted for, yet any resonating gas at earth frequencies has the same effect. Ozone depletion accounts for most of this.)

That’s it. If you can think of any other reasons, please, help me out!

Turn the worm and list the reasons to expect Carbon dioxide is not dangerously warming the planet.

1. We’re actually clueless.

(Yep, improved marginally since 1974)

2. The lower atmosphere has not warmed in a human generation.

(Yep, in spite of accelerating human CO2 and particulate production.)

3. Lower atmospheric temperature has been higher than today twice since the last glaciation and at peaks of the last interglacial period.

(Yep, before we began huffing and puffing)

4. Ice core data show that historically temperature has controlled CO2.

(Yep, but this does not constrain the possibility that recent additions could have changed the program)

That’s it. These lists are very short. A sad measure of our understanding. We will include one last list of possible ways to reconcile the paradox, and to explore mechanisms how addition of large amounts of resonating gas might not warm the planet very much.

1. Scale. CO2 represents only 2% of H2O by mass in the atmosphere. These two gasses do nearly all the work. Everything else being equal one should expect the effect to be proportionate. Humans are thought to be responsible for about 1/4 of the total CO2 in the atmosphere so that would amount to half a percent. But things are not equal. Gasses do not resonate as a mass, they do it as individual molecules. Water has an atomic weight of 8 and CO2 has an atomic weight of 22. In any given mass there will be nearly three times as many molecules of water as CO2. The half a percent just got divided again.

2. Saturation. Lots of HITRAN measurements have resulted in an empirical parameter, “Absorption Factor” that describes a roughly logarithmic diminution of effect by concentration.

CO2Abs4x

Compare this to the entire outgoing earth spectrum.

saturated


The units are different but the saturated bands at 15 microns in the first image from realclimate  are the big shark bite out of the middle of the piece of pie here. This cancels concern number 3, that CO2 occupies the top of the power spectrum. It also means that many of the teeth in that bite may come from water, whose absorption spectrum overlaps.

There are actually two different kinds of saturation in play. One is the absorption factor saturation where adding more gas has little effect. The other is light saturation where adding more light has little effect. The entire outgoing spectrum is light saturated. There is confusion here because light is considered a constant, yet more light energy cycles between resonating gasses and the surface than the earth receives from the sun. Greenhouse gasses effectively create more light by recycling the energy in the system..

3. Effective Sequestration. Most of the action in the photon food fight takes place near the surface where water in the atmosphere is strongly concentrated. Statistically, a molecule of CO2 has little chance of getting in the game.

4. About half of the “greenhouse” effect is not related to outgoing or foodfight recycled radiation, but rather from direct absorption of incoming solar radiation. Water is very active in these spectra and CO2 is a wimp. Blue is water, green CO2.

drawing

5. The very existence of the pause guarantees that there are natural forces at least equal to our production in play.

Another short list. In 1974 there had never been a credible correlation between human CO2 and temperature. We were well aware of the Physics as we are today. In the last 40 years we  have seen temperatures rise and suddenly level off as our production of CO2 has accelerated. Computer models predict temperatures will rise and cyclical models predict they will fall. In the end, we find ourselves in a situation much like 1974.


Posted in Climate, Climate Change, Cold is the New Hot, Global Warming, Greenhouse Effect, Greenhouse Spectra, Large Igneous Provinces, Photon Food Fight, Spectra, the "Pause" | Tagged , , | Leave a comment

The Pacific Doughboy and the Core

Here at the Trunkmonkey Research Institute we’ve been possessed of late by the Doughboys.

Doughboys

This representation is not really very good. It is a plate carree projection extruded as a box. Trouble is, when you bend it round like our planet, the surface, which is 2900 kilometers above the core (CMB) must grow substantially.

In the exercise below we have taken a less sophisticated series of cross sections we could get our hands on and projected it down to the core in Arcglobe. These sections to not show the doughboy extrusion up to the 660 km discontinuity where they flatten out like thunderheads hitting the stratosphere. Oh well, they show the real world position of the lower sections in the globe.

Myglobe.png

The amazing result of this is that when you center the doughboy in the view, you can see no continents. When you pan it any direction you find one real fast. The doughboy is nearly smack dab in the center of the Pacific ocean if you include what is now called the Southern Ocean.

We believe the doughboys are extrusions from the core.The outer core is molten. It is above the Curie point of Iron and has lost its magnetism. The Doughboy’s edges at least are probably above the Curie point . We believe the Doughboys are the armature of the earth’s magneto.

Posted in Climate, Geoid, Geology, LLSVP, LLSVP's are Doughboys, Seismic Tomography | Tagged , | Leave a comment

Doughboys

I have seen the following attributed to Ritsema and van Heist but have not found it in any of their papers.

Doughboys

People with no sense of verbal aesthetics have named the red things LLSVP’s for Large Low Shear Velocity Provinces. Sometimes they are called LLVSP’s, but if either of these acronyms were a glass of wine, I would pour it out. Clearly, those things are Pillsbury Doughboys, and will be referred to as doughboys henceforth.

The doughboys are low velocity  because they are warmer, less physically dense, or both. This aspect is controversial and though they are visible by both S and P earthquake waves the signs are  inverted and this is unusual.

The dots on the surface are presumed plumes, kimberlite (diamond forming) pipes, or Large Igneous Provinces. It has been observed that much of this activity can be mapped above the 1% attenuation plane which would be an imaginary line drawn about a quarter inch up from the bases of the doughboys. This is very interesting, but it makes no sense because we cannot see anything rising up from this plane which is very low in the mantle.

This correspondence with the 1% contour is touted as evidence the doughboys are very old, and it is certainly reasonable to suspect that they are, but some folks have gone hog wild with computer games moving them all around for the last three billion years and postulating plumes and slab return paths we don’t even have evidence for today.

It is important to consider that these doughboys seem to have little relationship to the configuration of ocean spreading ridges, and these ridges, like the Hawaiian hotspot, seem to be shallow pools of molten rock somehow maintaining themselves without deep mantle support.

Ritsema One need only compare our conceptions of the mantle and ocean ridges not so long ago to realize that these innocent doughboys have an attitude when it comes to our cherished preconceptions.

Dashed Conceptions

It is also very strange that Africa is sitting right on top of a doughboy. Africa is considered the keystone of Pangaea, having moved very little during the breakup. If the doughboy is indeed old, this would mean that Africa has been perched on its doughboy for a quarter of a billion years.


Posted in Africa Keystone of Pangea, Asthenia, Geoid, Geology, Large Igneous Provinces, LLSVP, LLSVP's are Doughboys, Moho, Seismic Tomography | Tagged , , | 1 Comment